Signs of Recovery Emerge after Economic Crisis Hits Innovation & IP Filings
Geneva,
September 15, 2010
PR/2010/655
A new WIPO report analyzing intellectual property (IP) trends in 2008 and 2009 shows that innovative activity and demand for IP rights dipped during the global economic crisis, but began to recover this year. World Intellectual Property Indicators 2010 also documents how the uncertainty associated with the crisis led companies to readjust their innovation strategies.
As the world economy started to slow sharply in 2008, an estimated 1.91 million patent, 3.3 million trademark, and 660,000 industrial design applications were filed across the world. Compared to 2007, these figures represent a slowdown in the growth of patent and industrial design applications and an actual decline in the number of trademark applications.
While the bulk of the report focuses on 2008 data (the last year for which complete worldwide statistics are available), a special section on the economic crisis looks at preliminary IP filing data for 2009 for the largest IP offices. These data reveal a drop in patent, trademark, and industrial design applications at many of these offices. In the majority of cases, non-resident applications were more negatively affected by the crisis than resident applications, suggesting a greater short-term focus on home markets (see Annex 1).
Beyond 2009, there are grounds for optimism as patent applications filed under the Patent Cooperation Treaty (PCT) system and international trademark registrations filed under the Madrid system have returned to growth.
WIPO Director General Francis Gurry observed: “The experience of the first six months of 2010 points to a modest recovery in PCT applications and a stronger rebound in Madrid international registrations.”
“The post-crisis innovation landscape will invariably look different from that of a decade ago,” Mr. Gurry added. “While the strength of the recovery remains uncertain, there will likely be a continuing geographic shift of innovative activity toward new players, especially in Asia.”
Drop in R&D expenditure in 2009
Data on R&D expenditure compiled for the report show that, on average, companies started to reduce their R&D budgets from early 2009 onward.
Data for publicly listed firms indicate a slowdown in year-on-year growth from 2007 to 2008, but reflect an actual decrease in R&D expenditure between 2008 and 2009 (-1.7%). However, the average hides substantial company-by-company variations (see Figure 1). Several of these companies reported substantial growth in R&D expenditure including a number of pharmaceutical firms.
Among these firms, the majority of automotive (e.g. General Motors, -24.5%, and Toyota, -19.8%), construction and consumer product companies (e.g. Caterpillar, -17.8%, and Unilever, -3.9%) decreased their R&D expenditure. A similar trend is observed for the majority of IT firms with a few exceptions, such as selected Chinese (ZTE, +45 %; and Huawei, +27 %) and US (Apple, +20%; and Microsoft, +10%) companies.
Figure 1: R&D expenditure of top 100 PCT applicants (2008-09/10 growth rate and 2009 volume in million US dollars)
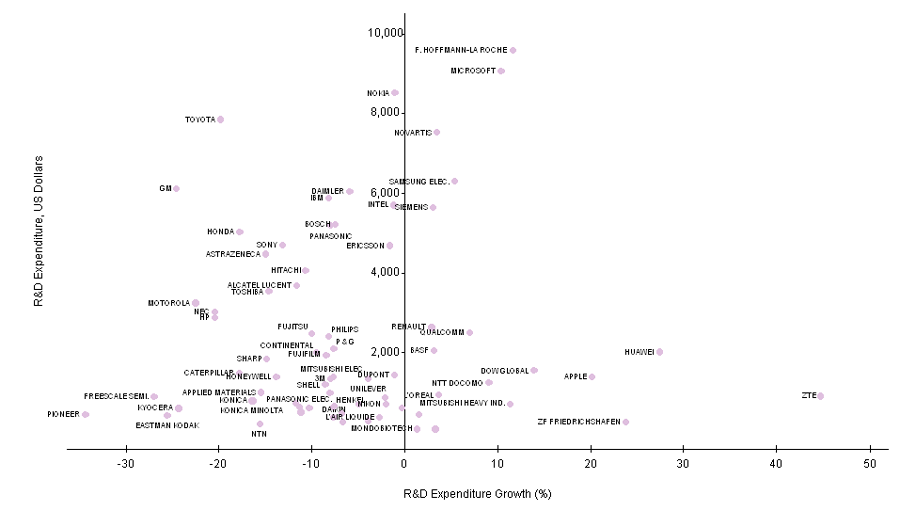
Note: The graph contains around 80 of the top 100 PCT applicants. Companies report their financial results according to different fiscal years. Abbreviations used: P&G (Procter and Gamble), HP (Hewlett-Packard), FREESCALE SEMI (Freescale Semiconductor), GM (General Motors). Source: WIPO, based on company filings at the US Securities and Exchange Commission or annual reports.
Slowdown in patent filings in 2008 was followed by a drop in 2009
In 2008, the total number of patent applications filed across the world grew by 2.6%, compared to 2007. This is the lowest growth rate since the dot-com crisis in the early 2000s. The slowdown is largely due to zero growth in applications filed in the United States of America (US), and a drop in applications in Japan (-1.3%) and the Republic of Korea (-1.1%). The substantial growth of applications in China (+18.2%) prevented the worldwide total from reaching zero growth in 2008.
Preliminary 2009 data show a drop in patent filings at most offices except for that of China, which exhibited growth of 8.5% in applications (see Figure 2). Taken together, the total number of patent applications filed at the nine patent offices listed in Figure 2 decreased by 2.9% in 2009, compared to 2008. As these offices accounted for around 84% of worldwide patent filings in 2008, an actual drop in the 2009 world total is likely.
In 2009, the total number of PCT applications declined by 4.5%, which is largely due to a drop in US resident PCT applications. The US accounted for three-quarters of the total drop in PCT applications. The drop in total PCT applications would have been even steeper without the growth of PCT applications originating from China, Japan and the Republic of Korea.
Figure 2: Patent and Trademark Applications Growth Rate (2008-09)
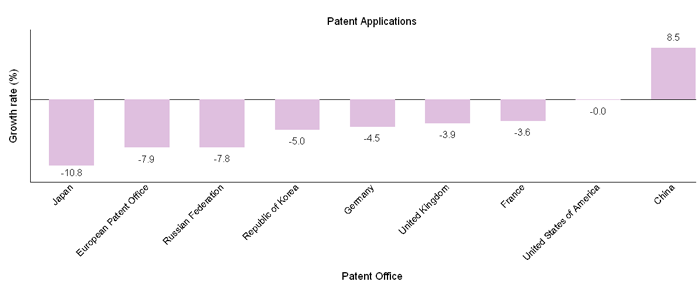
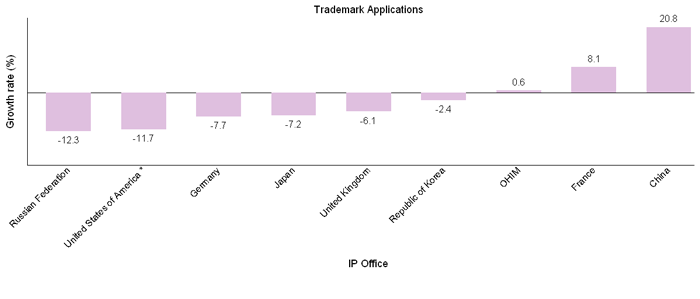
Note: * Fiscal year data for trademark applications. Source: WIPO Statistics Database
Drop in worldwide trademark fillings
Reflecting the weaker economic conditions, total trademark applications declined by 0.9% in 2008 – the first decrease since 2001. The drop in demand for trademarks is largely due to decreases in the number of applications filed by residents of China, Japan, Spain and the US.1
The available 2009 data for selected offices provide a mixed picture of the demand for trademarks. China and France recorded considerable growth in trademarks filings, while Germany, Japan and the US reported a drop. (Figure 2).
In 2009, Madrid system international registrations declined by 12.3%, representing the first decrease since 2002-03 and being primarily due to a fall in applications from residents of France, Germany and the US.
Growth in total industrial design applications, albeit at a slower pace
Industrial design applications increased by 5.7% in 2008, which is considerably lower than the growth rates for the previous three years. The substantial growth in the number of applications in China (+17%) is the main source of this worldwide growth in industrial design applications.
The number of international registrations under the WIPO-administered Hague system increased by 10% in 2009, which is below the growth rate of the previous year (33%).
The report also highlights other trends in the global IP system.
Patents
There was considerable growth in demand for energy-related patents – fuel cells, solar, wind and geothermal energy. Patent applications filed under the PCT System for those technologies increased from 584 applications in 2000 to 3,424 applications in 2009.
There was a slowdown in the growth of patent grants in 2008. The total number of grants across the world is estimated at 780,000 in 2008, representing a 0.6% increase from 2007. The slowdown is largely explained by a substantial drop in grants at the patent offices of the Republic of Korea (-32.5%). Without the substantial growth of grants in China, there would have been a contraction of total worldwide patent grants in 2008.
Around 6.7 million patents were in force across the world in 2008, representing a 5.3% increase over 2007. Patents in force in China and the Republic of Korea saw double-digit growth at 24% and 10.1%, respectively. Residents of Japan and the US owned around 48% of total patents in force in 2008
The worldwide number of utility model applications (313,000) and grants (238,000) grew by 15.3% and 12.2%, respectively, in 2008. The high growth in worldwide utility model activity despite the challenging global economic conditions is due to inventors from China continuing to expand their use of this form of intellectual property. In particular, utility model applications in China increased by 24.4% in 2008. Utility models are a form of IP similar to patents, but they usually have a shorter term of protection and less stringent eligibility requirements.
Trademarks
The trademark office of China was the largest recipient of trademark applications in 2008 with 670,000 applications. The combined share of the BRIC (Brazil, Russian Federation, India and China) countries was around 30% of all trademark applications in 2008, which is far above their combined share in patents.
In 2008, approximately 2.37 million trademarks were registered across the world, representing a 7% growth compared to 2007. China accounted for around 90% of the worldwide growth in trademark registrations and recorded the highest growth in trademark registrations (+56.8%), followed by the UK (23.6%) and the Russian Federation (21.7%).
Several countries accounted for substantial numbers of trademarks in force in 2008, notably Japan (1.7 million), the US (1.4 million), and France (1.1 million).
Industrial designs
For countries where data are available, France accounted for the largest number of designs in force in 2008, with around 400,000. However, China with a 40% growth rate is expected to surpass France in 2009. A large number of industrial designs were also in force in the European Union’s Office for Harmonization in the Internal Market, Germany and Japan – each accounting for more than a quarter million industrial designs in force.
Annex 1: Patent and Trademark Applications Growth Rate (2008-09)
Patent Applications Growth Rate (%)
| Patent Office | Total | Resident | Non-resident | |||
|---|---|---|---|---|---|---|
| 2008 | 2009 | 2008 | 2009 | 2008 | 2009 | |
| China | 18.2 | 8.5 | 27.1 | 17.7 | 3.4 | -10.3 |
| European Patent Office | 3.8 | -7.9 | n.a. | n.a. | 3.8 | -7.9 |
| France | -2.4 | -3.6 | 0.1 | -3.0 | -17.8 | -7.8 |
| Germany | 2.3 | -4.5 | 2.9 | -2.8 | 0.3 | -11.0 |
| Japan | -1.3 | -10.8 | -1.0 | -10.5 | -3.0 | -12.8 |
| Republic of Korea | -1.1 | -5.0 | -1.2 | -0.2 | -0.6 | -19.0 |
| Russian Federation | 6.1 | -7.8 | 0.8 | -7.6 | 18.5 | -8.3 |
| United Kingdom | -6.5 | -3.9 | -4.9 | -3.3 | -10.1 | -5.5 |
| United States of America | 0.0 | 0.0 | -4.0 | -4.4 | 4.6 | 4.4 |
Trademark Applications Growth Rate (%)
| IP Office | Total | Resident | Non-resident | |||
|---|---|---|---|---|---|---|
| 2008 | 2009 | 2008 | 2009 | 2008 | 2009 | |
| China | -1.8 | 20.8 | -2.4 | 25.6 | 2.8 | -15.0 |
| France | -3.0 | -7.7 | -3.7 | -6.2 | 2.1 | -16.9 |
| Germany | -16.6 | -7.2 | -19.0 | -5.4 | -5.2 | -14.4 |
| Japan | -1.6 | 0.6 | -4.2 | 6.1 | 4.7 | -11.3 |
| OHIM | -1.0 | 8.1 | -0.5 | 10.5 | -5.2 | -9.9 |
| Republic of Korea | -2.7 | -2.4 | -4.2 | 0.6 | 2.9 | -13.1 |
| Russian Federation | -0.3 | -12.3 | -4.7 | -11.9 | 5.0 | -12.8 |
| United Kingdom | -11.8 | -6.1 | -12.1 | -2.8 | -11.1 | -14.3 |
| United States of America 1 | -3.3 | .. | -4.0 | .. | 0.3 | .. |
| United States of America 2 | 1.2 | -11.7 | .. | .. | .. | .. |
Note: 1 = data for calendar year and 2 = data for fiscal year. Patent applications filed at the EPO are considered as non-resident applications. OHIM (Office for the Harmonization in the Internal Market). Source: WIPO Statistics Database
___________________________
1 For the US, data for trademarks refer to fiscal year – October 2008 to September 2009.
- Tel: (+41 22) 338 81 61 / 338 72 24