GII 2018: Localized Innovation
By Kyle Bergquist, WIPO Economics and Statistics Division, and Edward Harris, WIPO News and Media Section
The Global Innovation Index explores what constitutes a successful, economy-wide innovation ecosystem. Now in its 11th edition, the GII is widely recognized by world leaders and national-level policymakers as a useful tool for better understanding how to boost their countries’ innovative capacity.

But innovation is also a bottom-up phenomenon, with people pursuing new ideas where they work and live, either as individuals or within companies, universities and research institutions. What is it about certain places and contexts that foster greater innovation activity than others?
Answering this is the goal of a team of WIPO researchers who have introduced a new feature to the GII, using big data and the latest mapping techniques to pinpoint centers of innovation-related activity around the world.
This year, WIPO’s economists added scientific articles to their cluster analysis that had focused on patent applications filed via WIPO’s Patent Cooperation Treaty (PCT), also known as the International Patent System.
WIPO’s cluster analysis, which debuted in the 2017 GII report, is the first of its kind to look at patents and scientific publications on a global scale. It helps decision makers better understand the local features of innovation.
The data for evaluation this year include some 1 million patents filed via the PCT during 2012-16, listing 2.8 million inventors based in nearly 1 million unique addresses.
Also surveyed are 8.5 million scientific articles, listing 22.5 million authors from 7.4 million unique addresses.
An algorithm then sorts these data by locality, using advanced mapping techniques. What results is a rich, visual representation of the density of these innovation-related activities in centers across the globe.
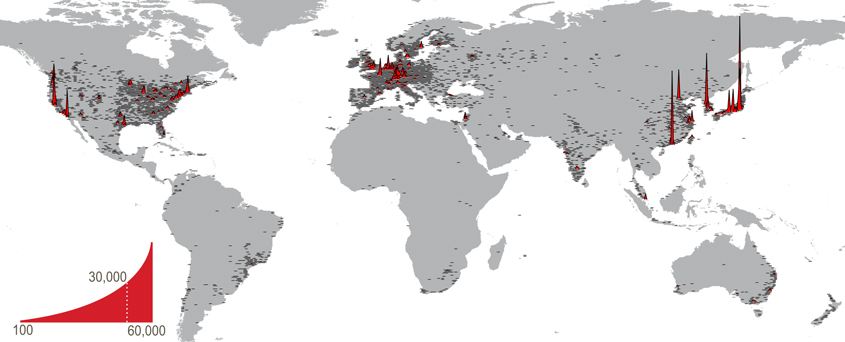
The following graphic illustrates international patent-filing activity by cluster, with PCT applications per 100 square kilometers:
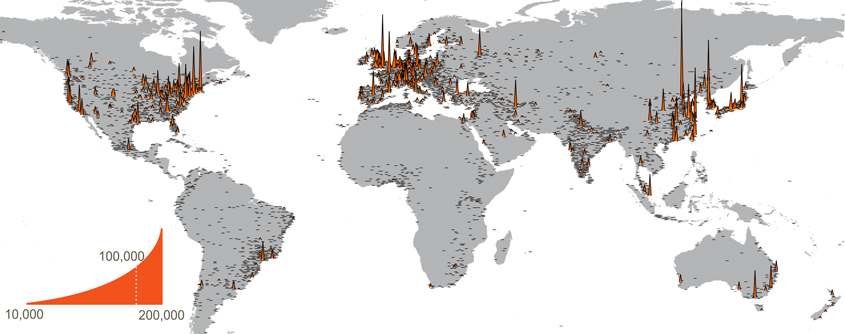
The next graphic shows scientific publishing intensity by cluster, by plotting publications per 100 square kilometers:
Adding scientific publications to the patent data turned up some interesting new findings for the GII 2018 ![]() :
:
- The top 100 clusters are found in 28 economies. The U.S., with 26 clusters, accounts for the highest number, followed by China (16), Germany (8), the United Kingdom (4), and Canada (4).
- Beyond China, clusters from five middle-income countries rank among the top 100 - from Brazil, India, the Islamic Republic of Iran, the Russian Federation and Turkey.
- The Tokyo-Yokohoma cluster comes out on top, with the greatest grouping of inventors and scientific authors combined, besting by a wide margin the 2nd ranked Shenzhen-Hong Kong cluster.
- Beijing, the cluster showing the strongest scientific publishing activity, rose in the rankings.
- San Diego, previously 6, marked a drop, reflecting its relatively weaker publishing performance.
- The New York cluster rose to 8th place; this largely reflects a data set change which expanded the cluster to include the Princeton, NJ area.
This cluster analysis paints a preliminary snapshot of innovation at the local level. With this analysis WIPO economists and statisticians establish an initial baseline that will be improved over time.
Innovation is a highly complex, rapidly changing phenomenon. Studies need to keep pace with this evolution.
WIPO’s on-going investment in the analytical and econometric techniques applied to its statistics database ensures that the resources and tools WIPO offers decision makers continue to improve and add value as policy makers deliberate the choices they face.
Find out more
- GII 2018: Which Economies Are Innovating Efficiently?
- GII 2018: China Cracks Top 20 (WIPO Press release)