Global IP Filings Continue to Grow, China Tops Global Patent Filings
Geneva,
December 11, 2012
PR/2012/726
Infographic: China's patent surge
Press Conference ![]() Video
Video
A new WIPO report shows that while the global economy continued to underperform, intellectual property (IP) filings worldwide kept growing strongly in 2011. It also finds that China’s patent office became the largest in the world, as measured by the number of patent applications received. Before 2011, China already accounted for most filings of utility models (UMs), trademarks and industrial designs.1
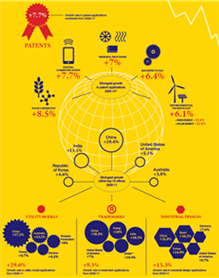
World Intellectual Property Indicators 2012 shows that patent filings worldwide grew by 7.8% in 2011, exceeding 7% growth for the second year in a row. Similarly, UM, industrial design and trademark filings increased by 35%, 16% and 13.3%, respectively.
“Sustained growth in IP filings indicates that companies continue to innovate despite weak economic conditions. This is good news, as it lays the foundation for the world economy to generate growth and prosperity in the future,” said WIPO Director General Francis Gurry.
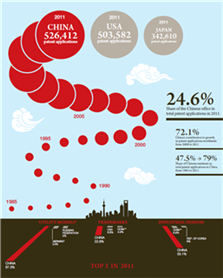
China’s State Intellectual Property Office (SIPO) overtook the United States Patent and Trademark Office (USPTO) in 2011 to become the largest patent office in the world, after having surpassed the Japan Patent Office (JPO) in 2010. In the 100 years before 2011, only three patent offices – Germany, Japan and the United States - had occupied the position of largest office.
In the Report’s foreword, Mr. Gurry points out that “even though caution is required in directly comparing IP filing figures across countries, these trends nevertheless reflect how the geography of innovation has shifted.”
Patents & Utility Models
For the first time in 2011, the total number of patent applications filed worldwide exceeded the 2 million mark. The 2.14 million applications filed consisted of 1.36 million resident and 0.78 million non-resident applications. Following a drop of 3.6% in 2009, patent applications rebounded strongly in 2010 with growth of 7.5% and with 7.8% growth in 2011.
IP grows despite economic woes
In 2011, China received 526,412 applications compared to 503,582 for the US and 342,610 for Japan. The growth in patent filings in China was mostly due to sharp growth in resident filings. Between 2009 and 2011, patent filings worldwide increased by 293,900. SIPO accounted for 72% of this increase.
The majority of the top 20 offices saw growth in patent filings in 2011 with China (34.6%), China Hong Kong (SAR, 15.3%) and South Africa (13.5%) seeing double-digit growth. Filing behavior at offices of middle- and low-income countries show mixed trends.2 The offices of Algeria (11.3%), Madagascar (41.9%) and Saudi Arabia (6.3%) saw considerable growth in 2011, mainly due to growth in non-resident filings. In contrast, Guatemala (-13.1%), Jamaica (-27.6%) and Jordan (-15.6%) saw substantial filing declines.
Data by applicants’ country of origin show that residents of Japan filed the largest number of applications (472,417) across the world in 2011. China, which saw 41.3% growth in 2011, overtook the US to become the second largest country for origin counts.
The field of digital communication saw the highest average annual growth rate (+8.1%) between 2006 and 2010. Filings for pharmaceuticals have continuously declined since 2007.3 Computer technology accounted for the largest number of applications (126,897) filed worldwide.4
Patent applications for four energy-related technologies – fuel cells, geothermal, solar and wind energy - increased by 8% in 2010 to 34,873. Residents of Japan filed the largest number of applications relating to solar energy and fuel cell technologies, while residents of Germany and the US accounted for the largest numbers of applications relating to geothermal and wind energy, respectively.
In 2011, the estimated number of patents granted approached the 1 million mark, with 606,800 issued to residents and 390,000 to non-residents. Grants worldwide grew by 9.7% in 2011. The JPO (with 238,323) granted the largest number of patents, followed by the USPTO (224,505).
The number of potentially pending applications worldwide – defined as all unprocessed applications at any stage in the applications process – declined by 4.9% in 2011, following a 3.3% decrease in 2010. The JPO was the main contributor to this trend. Based on estimates from 76 offices, the number of potentially pending applications worldwide stood at 4.8 million in 2011.
An estimated 670,700 UM applications were filed across the world in 2011, corresponding to a 35% increase on 2010. Filings at SIPO accounted for most of this increase. Residents of Japan and the US filed the largest numbers of UM applications abroad, of which a large proportion were received by SIPO.
Trademarks
A record 4.2 million trademark applications were filed worldwide in 2011. Around 6.2 million classes were specified in these applications. Of the 6.2 million application class counts, residents accounted for 4.5 million and non-residents for 1.7 million.5
Applications grew by 13.3% in 2011, while application class counts saw a 9.6% increase. Rapid growth in filings in China has been the main contributor to growth in recent years. In 2011, China accounted for 61.8% of growth worldwide.
The majority of the top 20 offices saw growth in filings in 2011 (based on class count data), with China (31.2%), Brazil (21.6%), the United Kingdom (16.4%) and China Hong Kong, SAR (16.1%) recording the fastest growth. The IP office of India has also seen considerable increases over the past few years. In fact, India surpassed Japan in 2010 and the Republic of Korea in 2011.
German applicants filed more than 2.1 million equivalent applications worldwide in 2011.6 Residents of China (1.4 million), the US (1.3 million) and France (1.0 million) were the only three other origins to have filed more than a million applications each. The bulk of Chinese filings were filed domestically. In contrast, the majority of the applications originating in Germany, France and the US were filed abroad.
Industrial Designs
Industrial design applications worldwide grew strongly over the last two years. In 2011, design filings increased by 16%, following 13.9% growth in 2010. This considerable growth was mostly due to strong growth in China. SIPO accounted for 90% of total growth from 2009 to 2011. The 775,700 industrial design applications filed worldwide in 2011 consisted of 691,200 resident and 84,500 non-resident applications.
Unlike patents, the list of top 20 offices includes 8 offices located in middle-income countries. China – a middle-income country – received the largest number of design applications (521,468) in 2011. Turkey, another middle-income country, received 41,218 filings, which is larger than the number of filings at the JPO or the USPTO. Between 2010 and 2011, the IP offices of China (23.8%), India (16.7%), Mexico (17.2%), Turkey (17.6%) and Ukraine (17.5%) each saw rapid growth in filings.
Plant Variety Protection
Between 1995 and 2011, the number of plant variety applications7 worldwide increased from 10,000 to over 14,000. In 2011, they grew by 7.8% - the fastest growth since 2007. Growth in applications in Israel and the Community Plant Variety Office (CPVO) of the European Union (EU) accounted for 60% of the total growth in 2011.
The CPVO received the largest number of applications (3,184), followed by the offices of China (1,255), the US (1,139), Japan (1,126) and Ukraine (1,095).
_______________________
1. Like patents, UMs protect inventions for a limited period of time. However, the terms and conditions for granting UMs are different from those for “traditional” patents. In certain countries, UMs are known as “petty patents”, “short-term patents” or “innovation patents”.
2. The income groups correspond to those used by the World Bank. Economies are divided according to 2011 gross national income per capita.
3. The micro-structure and nano-technology field saw 11% growth in 2011, but it accounts for a relatively small number of applications (988 applications in 2011).
4. Technology data are a combination of those taken from the WIPO Statistics Database and the PATSTAT database of the European Patent Office (EPO) (using the April 2012 edition of the PATSTAT database). The latest available data are for 2010.
5. Class counts refer to the number of classes specified in trademark applications. Offices use either single- or multiple-class filing system. Class counts account for this institutional difference and thus enable better comparisons of filing figures across offices.
6. The concept of equivalent applications takes account of the fact that an application at a regional office can cover multiple jurisdictions. Equivalent applications data are expressed in terms of class counts.
7. The International Convention for the Protection of New Varieties of Plants (UPOV Convention) provides a sui generis form of intellectual property protection (plant variety protection or breeders’ rights). In order to obtain protection, the breeder needs to file individual applications for breeders’ rights with the authorities entrusted with the task of granting breeders' rights.
- Tel: (+41 22) 338 81 61 / 338 72 24