How Intensively Are New Technologies Used?
2026年7月2日
2026年7月2日 ・ minutes reading time

Economies are adopting new technologies more than 60 times faster than ever before. Adopting a technology and using it intensively are two very different things. Even when a country adopts electricity generation and distribution, not every household will be immediately connected to the grid. Large productivity increases will happen not only when households access electricity for illumination, but when they use it more intensively by connecting home appliances such as refrigerators. This gap between adoption and actual use, what we call the intensity gap, reveals a deeper dimension of technological dissemination than adoption rates alone can capture.
On average, developing economies use technologies at only 53% of the level observed in advanced economies—a 47-percentage-point gap.
This pattern has remained remarkably consistent over time. In the 19th century, today's developing economies lagged far behind in their use of ships, railways, and telegraph systems. Even when these technologies eventually arrived, they were deployed much less comprehensively than in wealthy nations. The gap was not just about timing; it was about depth of use, though substantial variation existed across countries and technologies.
Discover how intensively economies are using technologies
Mobile technologies: a dramatic reversal
Mobile communication technologies show a dramatic reversal of the low usage pattern. According to our estimations that control for adoption lags, non advanced economies exhibit 110% intensity for 2G, 98% for 3G, and 135% for 4G, representing a 35% percentage point advantage over advanced economies. This progression provides compelling evidence of technological leapfrogging, where developing countries bypassed fixed-line infrastructure to adopt and use mobile technologies more intensively than their advanced counterparts. Kenya's M-PESA is perhaps the most vivid example. As highlighted in WIPR 2024, the mobile banking platform enables secure electronic cash transfers through SMS, available on virtually every SIM-card mobile phone. With mobile already ubiquitous, adoption was fast and adaptation was creative, expanding financial access for farmers and opening the door to a new generation of AgTech startups.
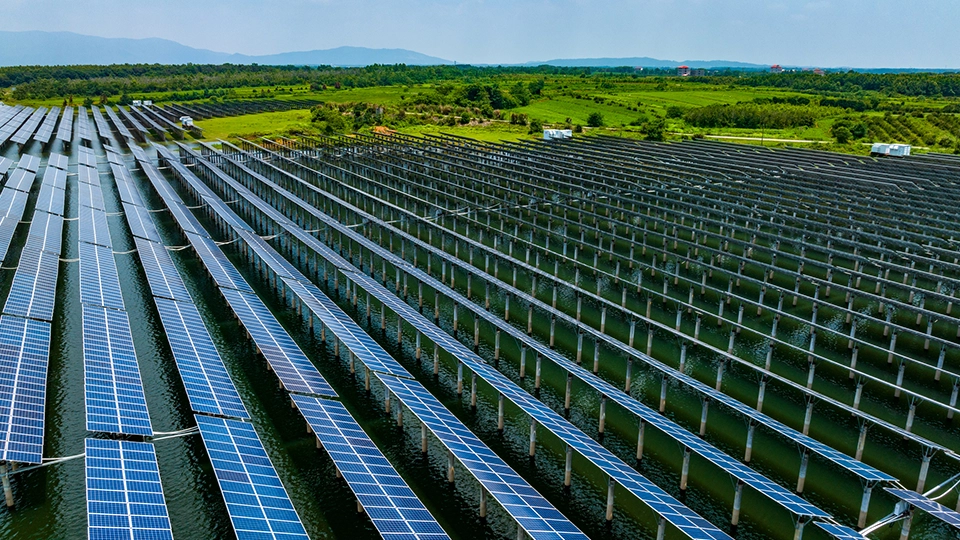
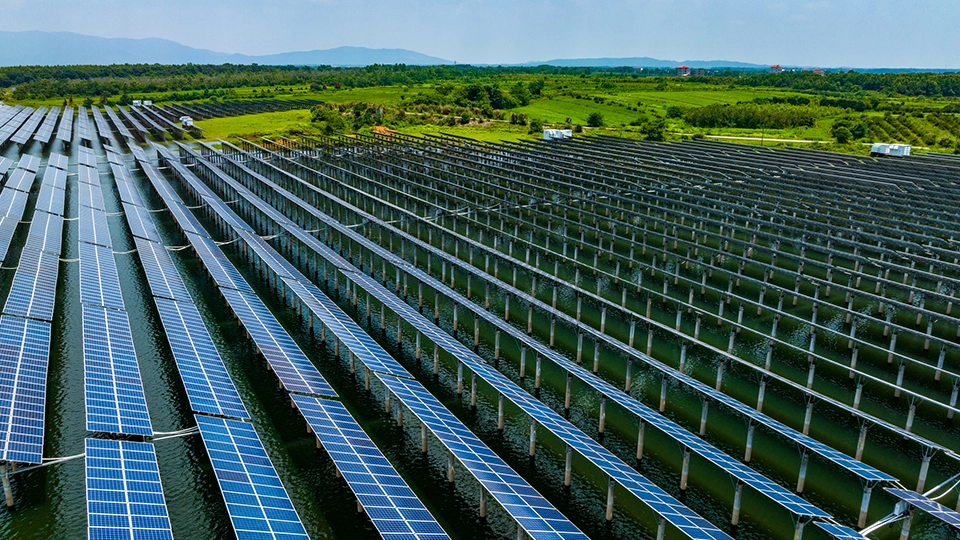
The intensity gap shrinks dramatically as we move from older to newer technologies. Wind energy, solar panels, and electric vehicles still show some gap, but nothing like the massive disparities seen in telegraphs or telephone systems.
Why digital technologies enable intensive use
As noted in WIPR 2026, digital technologies possess unique characteristics that enable not just rapid adoption, but intensive use:
- Lower infrastructure costs: No need to wire every building.
- Network effects: Value increases as more people connect.
- Mobile-first design: Optimized for contexts where they will actually be used.
- Declining hardware costs: Smartphones become affordable quickly.
Using technologies intensively makes a difference
While adoption speed matters, usage intensity may be even more critical for economic development. Barely used technology generates little value, but when developing countries use digital technologies more intensively than wealthier nations, they can accelerate development in unprecedented ways.
Since the 1990s, technological intensity and economic growth rates have converged simultaneously between rich and poor countries. This parallel timing suggests an important link between digital technology diffusion and narrowing economic gaps that deserves deeper investigation.
Related Resources
- Read the working paper: How Do New Technologies Diffuse?
- Read the full report: World Intellectual Property Report 2026