Rationale and origins
The Global Innovation Index (GII) was created in 2007 by Prof. Soumitra Dutta (then at INSEAD), designed to establish comprehensive metrics and methodologies for capturing the broad range of innovations across economies. Since 2011, the GII has been elaborated in partnership with the World Intellectual Property Organization (WIPO), until in 2021 WIPO became the sole publisher of the GII, in partnership with the Portulans Institute headed by Prof. Dutta.
From its inception, the GII has been driven by multiple factors. Innovation serves as a fundamental engine for economic advancement and competitive advantage both across mature and emerging economies. Governments worldwide have increasingly come to regard innovation as the cornerstone of their growth frameworks. Yet, the conceptual boundaries of innovation have expanded significantly beyond the traditional confines of research and development (R&D) laboratories and academic publications. Today's innovation landscape encompasses a broader, more interconnected spectrum that integrates social transformation, business model evolution, social innovation and technological advancement. Furthermore, acknowledging and showcasing the achievement of innovation in developing markets plays a vital role in motivating individuals, particularly emerging entrepreneurs and the next wave of innovators.
Currently in its 18th iteration, the GII fosters an ecosystem in which innovation elements undergo continuous assessment and refinement. It serves as an essential instrument for policymakers, while maintaining an extensive repository of granular metrics that provides a comprehensive information source for enhancing innovation strategies.
Quantifying innovation outcomes and their broader implications continues to present significant methodological challenges. Consequently, substantial focus is directed toward evaluating the foundational conditions and infrastructure that enable innovation, alongside the measurement of the results.
To address the question of measurement, in 2024, WIPO launched the GII–iLens Innovation Data Lab series to explore new metrics to complement the GII, addressing gaps in innovation measurement through the piloting of new indicators and the testing of emerging data sources in priority areas, including innovation finance, startup ecosystems, deep science applications, and innovation linkages. The GII iLens workshops explore new big data sources enabled by artificial intelligence and advanced data tools that are particularly valuable when traditional statistics are delayed or unavailable.
In addition, since end of 2022, monthly GII Innovation Insight blogs explore particular innovation indicators in depth.
While the final output appears in the form of a comparative ranking system, the GII's fundamental purpose centers on advancing a "pathway" toward more precise measurement techniques, deeper innovation comprehension, and the identification of specific policies, best practice, and those mechanisms that enhance innovation. The comprehensive data framework, spanning index, sub-index and individual indicator levels, enable performance tracking across time periods and facilitate benchmarking against economies within similar regional contexts or income classifications.
Defining innovation in the GII
The GII embraces an expansive conceptualization of innovation, rooted in the foundational framework established by the Oslo Manual, developed jointly by Eurostat and the Organisation for Economic Co-operation and Development (OECD). The Oslo Manual's fourth iteration in 2018 presented a refined and more encompassing definition of innovation: "An innovation is a new or improved product or process (or combination thereof) that differs significantly from the unit's previous products or processes and that has been made available to potential users (product) or brought into use by the unit (process)."(
This revision of the Oslo Manual simultaneously introduced comprehensive definitions relevant to business innovation and various categories of innovative enterprises. Within this framework, innovation manifests as enhanced outcomes achieved through novel goods and services, or integrated combinations thereof. The GII increasingly recognizes that innovation measurement must account for hybrid models that blur traditional boundaries between products and services, particularly within the digital economy where platform-based innovations create entirely new value ecosystems.
The understanding and conceptualization of innovation has undergone substantial transformation over recent decades. Previously, economists and policymakers concentrated primarily on R&D-driven technological product innovation, predominantly developed internally within manufacturing sectors. This innovation paradigm was characterized by highly skilled workforces operating within R&D-intensive organizations. The underlying process was understood as closed, internally focused, and geographically contained. Technological advances were necessarily "revolutionary" in nature and occurred at the "global knowledge frontier." This perspective inherently suggested a division between leading and trailing economies, with low- and middle-income nations relegated to a "catch-up" role.
Innovation capability is increasingly understood as the capacity to leverage novel technological combinations, encompassing incremental advancement and "innovation without research" paradigms. Non-R&D innovative investment represents a crucial element in realizing the benefits of technological innovation. The rise of frugal innovation and reverse innovation models demonstrates how resource-constrained environments can generate breakthrough solutions that subsequently influence global markets, challenging traditional innovation hierarchies. Growing attention focuses on understanding innovation evolution in low- and middle-income economies, accompanied by recognition that incremental innovation forms can significantly impact development, and that innovation flourishes within the informal economies of developing nations (
The innovation process itself has experienced a profound transformation. Investment in innovation-related activities and intangible assets has escalated consistently across firm, national, and global dimensions, incorporating novel innovation actors from beyond high-income economies, as well as non-profit participants. Knowledge production structures have become more intricate, collaborative, and geographically distributed than ever before.
From its inception, the GII has prioritized the comprehensive coverage of creativity and creative outputs, adopting an integrated perspective that transcends the traditional decompartmentalized approach that separates innovation from creativity. The GII editorial team instead maintains that innovation and creativity represent complementary aspects of a unified phenomenon.
The emergence of AI-powered innovation tools and digital collaboration platforms has fundamentally altered the speed and scale at which creative ideas can be tested, refined, and implemented, requiring new measurement approaches that capture both human creativity and machine-augmented innovation processes.
A fundamental challenge involves identifying metrics that accurately capture innovation as it manifests in today's world. Direct official measures quantifying innovation outputs remain exceptionally limited. For instance, no official statistics exist documenting the volume of innovative activity – characterized as the quantity of new products, processes, or other innovations – for any specific innovation actor, much less for entire countries. Most measurement approaches also fail to adequately capture innovation outputs from a broader spectrum of innovation actors, including users, public and service sectors, or informal mechanisms that frequently drive innovation within developing economies.
The GII strives to enhance innovation measurement in order to provide more a comprehensive representation of innovation ecosystems globally. It continuously explores novel metrics, so as to best reflect innovation's evolving nature and the expanding landscape of new big data innovation indicators.
Interest in applying GII frameworks and indicators to develop complementary sub-national innovation indices continues to grow among WIPO member states.
The GII conceptual framework
The GII's conceptual framework centers on dual sub-indices of equal importance for capturing comprehensive innovation ecosystems: the Innovation Input Sub-Index and the Innovation Output Sub-Index. This design yields three calculated measures:
Innovation Input Sub-Index: Five core pillars represent those economic factors that foster and enable innovative activities. The conceptual foundation holds that current innovation investments – including endeavors to advance scientific capacity, innovation infrastructure, human capital formation, and supportive innovation environments – create the necessary conditions for future innovation outputs.
Innovation Output Sub-Index: Innovation outputs manifest from innovative activities across economic systems. Despite containing only two pillars, the Output Sub-Index maintains equal influence with the Input Sub-Index in overall GII score determination. This structure means innovation output elements and indicators receive disproportionately higher weighting versus innovation inputs.
Overall GII score: Refers to the average of the Input and Output Sub-Indices, from which the GII economy rankings are produced.
This year's conceptual framework includes 78 different indicators, demonstrating a continuous evolution in addressing emerging innovation measurement challenges (see Economy profiles section for the complete Framework of the Global Innovation Index 2025). The seven aforementioned pillars (five input, two output) each contains three sub-pillars, with individual indicators comprising each sub-pillar. Sub-pillar values are derived from the weighted averaging of indicator scores, normalized to generate 0–100 scale results. Pillar scores emerge through the weighted averaging of constituent sub-pillar values.
WIPO's sole editorial responsibility since 2021 has required the development of an advanced data infrastructure as part of comprehensive GII modernization efforts, targeting improved data quality, enhanced quality control processes, and strengthened model robustness and replicability (Appendix Box 1). This infrastructure enables the integration of non-traditional data sources and real-time analytics capabilities in support of a gradual transition from static annual assessment and ranking toward a more dynamic innovation monitoring system.
To facilitate and permit a comprehensive workflow for the GII model, from data storage to GII calculations, a robust data infrastructure was developed in 2021 and has been progressively improved upon ever since. The data infrastructure comprises five parts.
Data storage – the GII database: All GII data are stored, maintained and managed in the GII database. The database stores all collected data in a structured manner for every WIPO member state (not only the ranked GII economies) and for all indicators. It also stores data on outlier analysis (generated by the data quality checks undertaken by the GII team after data collection). As of 2024, the database has expanded to also include country level and global aggregate data related to the Global Innovation Tracker. In addition, the micro-level data – often related to companies – used in the aggregation of certain GII indicators (e.g., Global corporate R&D investors, Unicorn companies' valuation, companies' Intangible asset intensity, Global brand value, top universities, etc.) has been further expanded and standardized.
Code repository – the GII repository of collaborative codes: The GII repository of collaborative codes is on GitHub. The GII repository contains several repositories in statistical programming language R (R-codes), which are linked to diverse elements of the GII workflow and the GII report, thus enabling data collection, data calculation and the data quality control of all GII indicators. Since 2024, the repository also includes updates for the Global Innovation Tracker – including for trend calculations at the country level.
Data governance – the GII data quality and audit controls: Assuring data quality control is at the center of GII methodology and processes. Each collected indicator undergoes a rigorous quality control and audit process annually. Several data tests and analyses are performed on all collected indicators, including the analysis of means, identification of outliers based on mean and z-scores for both unscaled and scaled data, analysis of rank changes, analysis of missing data and analysis of outdated data. Following these analyses, the GII team goes back to the data providers for any necessary clarification and, when required, the data providers themselves correct the data at source. This process is further reinforced by an annual independent statistical audit from the European Commission's Joint Research Centre (JRC), which validates the statistical soundness of the GII framework (see Appendix II for more details). These comprehensive quality assurance measures uphold the highest standards of data integrity essential for the GII.
Model calculation – the GII R-package for the calculation of the GII model: The GII R-package – called GII2 – is a custom-built package of tools created using R to calculate the GII model and analyze its results. The structure of the tailor-made GII R-package follows the general COIN R-package developed by the European Commission Joint Research Centre (JRC) and follows the steps in the
Supporting tools – the GII Innovation Ecosystems and Data Explorer, and Monitoring reports: Since 2024, emphasis has been given to the visualization and improved presentation of the GII data and results through the new GII Innovation Ecosystems and Data Explorer. In collaboration with OneTandem, the data explorer lets users dynamically generate GII economy briefs, profiles and country comparisons seamlessly, and to look into the time series of all GII indicators, including into individual data and micro-data on intangible assets, top universities, the most valuable brands and others. In 2024, data on Cluster Ranking, including individual Cluster briefs, were added to the website. Since 2025, regional briefs have also been available highlighting the innovation performance of economies across the world's major regions. These regional briefs provide comparative data on science and technology investment, economy rankings, and key trends in leading innovation indicators. The Data Explorer is also available in Spanish and optimized for use on mobile devices.
In addition, The GII Economy Monitoring Board is a specialized report designed to track and improve data reporting from non-GII economies (available upon formal request). It summarizes the current reporting status of economies not yet included in the GII, identifying specific indicators that are either missing or outdated, while documenting the various data sources used. This report serves as a basis for targeted engagement with economies to improve their data coverage, enabling the GII team to facilitate connections between official government sectors and relevant data providers. The primary purpose is to help economies to improve their data coverage, so as to potentially qualify for inclusion in the GII.
This infrastructure enables a complete workflow linking data storage and data quality control with data analysis (GII rankings and the GII report) and stakeholder engagement in a fully integrated way, thereby increasing the overall robustness of the GII data and model.
Finally, the GII team continues exploring and improving the measurement of innovation through the GII–iLens Innovation Data Lab (Box 1, Results section). By experimenting with data and novel data-driven approaches, the Data Lab series aims to develop new, actionable innovation metrics by piloting indicators in underexplored but policy-relevant areas like venture capital, startups, and deep science. It leverages big data and advanced analytical tools to address measurement gaps and inform future editions of the GII.
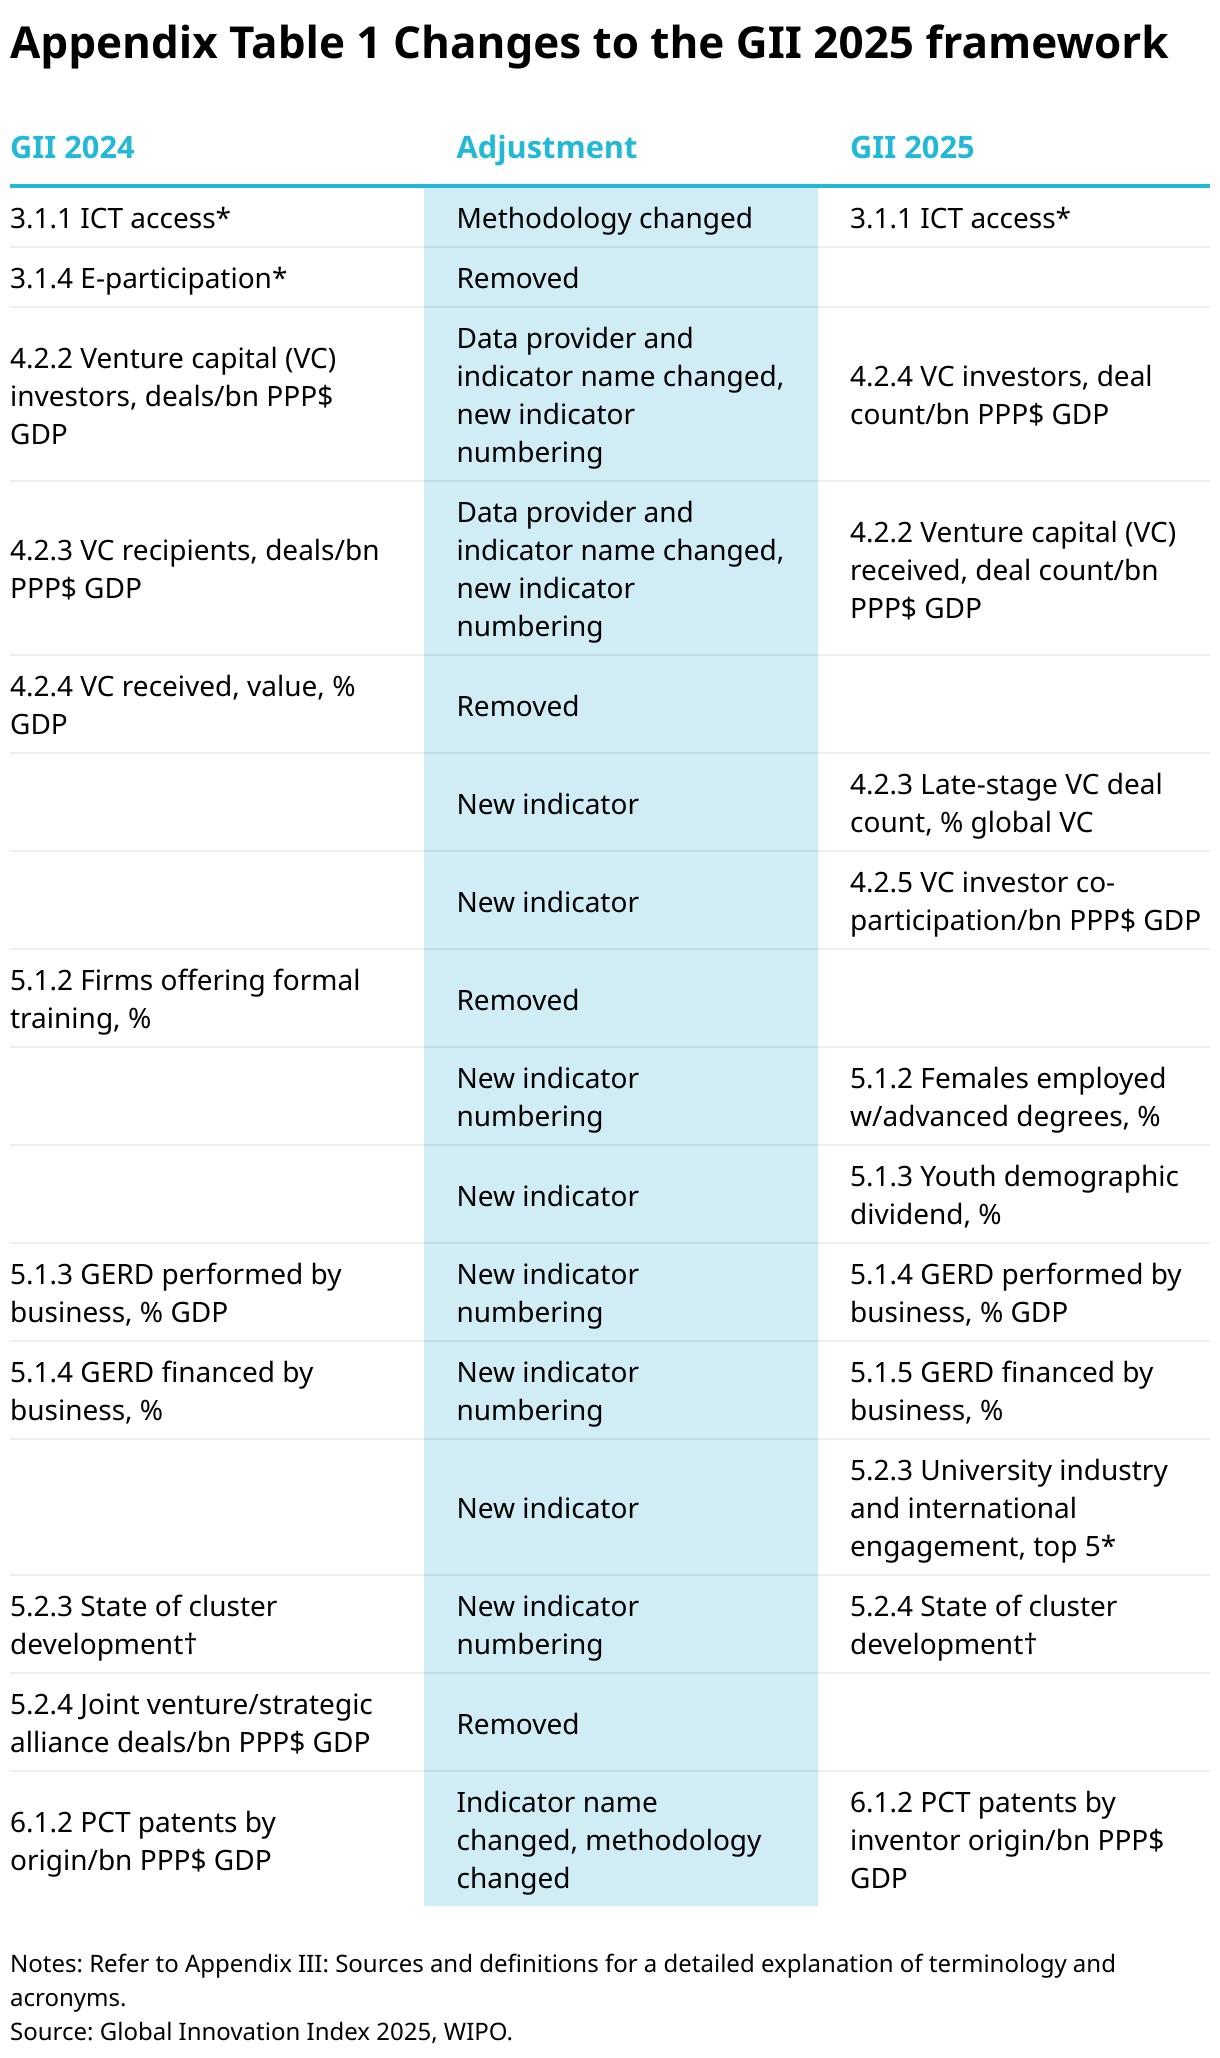
Adjustments to the GII model in 2025
Appendix Table 1 summarizes the adjustments made to the GII 2025 framework. The methodology has changed for two indicators (3.1.1 and 6.1.2). In addition, there are four new indicators, and four indicators have been dropped from the framework. Due to the addition and removal of these indicators, the numbering of four remaining indicators has been adjusted, but without altering their methodology. Lastly, the name of two indicators and their numbering has been modified following a change in data provider (4.2.2 and 4.2.4).
Data limitations and treatment
This year, the GII model includes 139 economies, representing 93.6 percent of the world's population and 98 percent of the world's GDP in purchasing power parity current international dollars (PPP$).
The timeliest possible indicators are used for the GII 2025: from the non-missing data, 5.2 percent are from 2025, 33.6 percent are from 2024, 40 percent are from 2023, 11.4 percent are from 2022, 4 percent are from 2021, 1.4 percent are from 2020, and the small remainder of 4.4 percent are from earlier years.
The GII 2025 model includes 78 indicators, which fall into three categories:
quantitative/objective/hard data (63 indicators);
composite indicators/index data (10 indicators); and
survey/qualitative/subjective/soft data (5 indicators).
This year, for an economy to feature in the GII 2025, the minimum data coverage requirement is at least 35 indicators in the Innovation Input Sub-Index (66 percent) and 15 indicators in the Innovation Output Sub-Index (66 percent), with scores for at least two sub-pillars per pillar. Since GII 2024, indicator 6.1.3 – Utility models by origin/bn PPP$ GDP has been excluded from the minimum data coverage (DMC) requirement. In the GII 2025, 139 economies had sufficient data available to be included in the Index. A total of 110 economies did not make it into the GII 2025 due to a lack of available data. For each economy, only the most recent yearly data were considered. As a rule, the GII indicators consider data from as far back as 2015.
Missing values
For the sake of transparency and the replicability of results, missing values are not estimated; instead, they are indicated with "n/a" and are not considered in the sub-pillar score. In other words, missing indicators do not translate into a zero for the country in question; the indicator is simply not taken into consideration in the aggregation process.
That said, the audit undertaken by the European Commission's Competence Centre on Composite Indicators and Scoreboards at the Joint Research Centre (JRC-COIN) (see Appendix II) assesses the robustness of the GII modeling choices (no imputation of missing data, fixed predefined weights and arithmetic averages) by imputing missing data, applying random sets of perturbed weights and using geometric averages. Since 2012, based on this assessment, a confidence interval has been provided for each ranking in the GII, as well as for the Input and Output Sub-Indices (Appendix II).
Treatment of series with outliers
Potentially problematic indicators with outliers that could polarize results and unduly bias the rankings were treated according to the rules listed below, as per the recommendations of the JRC-COIN. Only hard data indicators were treated (34 out of 63).
First rule: selection
Indicators were classified as problematic if they had:
an absolute value of skewness greater than 2.25; and
kurtosis greater than 3.5.
(3)Based on Groeneveld and Meeden (1984), which sets the criteria of absolute skewness above 1 and kurtosis above 3.5. The skewness criterion was relaxed to accommodate the small sample under consideration (139 economies).
Second rule: treatment
Indicators with between one and five outliers (23 cases) were winsorized; the values distorting the indicator distribution were assigned the next highest value, up to the level where skewness and/or kurtosis had the values specified above.
Indicators with five or more outliers, and for which skewness or kurtosis did not fall within the ranges specified above, were transformed using natural logarithms after multiplication by a given factor f.
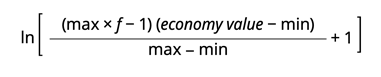 where "min" and "max" are the minimum and maximum indicator sample values, respectively.
Normalization
The 78 indicators were then normalized into the [0, 100] range, with higher scores representing better outcomes. Normalization was undertaken according to the min–max method, where the "min" and "max" values were the minimum and maximum indicator sample values, respectively. Following the recommendation of the JRC-COIN, all indicators, including index and survey data, were normalized to a 0–100 range. Such normalization ensures that all indicators share the same range, facilitating their individual contribution to the overall index score.
Weights
In 2012, the JRC-COIN and GII team made a joint decision that scaling coefficients of 0.5 or 1.0 should be used instead of importance coefficients. This decision aimed to achieve balanced sub-pillar and pillar scores by considering the underlying components. In other words, the goal was to ensure that indicators and sub-pillars contribute a similar amount of variance to their respective sub-pillars/pillars.
To prevent multicollinearity during the aggregation process, any indicators within a sub-index that exhibited a high correlation, exceeding an absolute correlation of 0.95, were assigned a weight of 0.5. In 2025, there were no indicators that received a 0.5 weight, and thus all indicators had a weight of 1. Additionally, two sub-pillars – 7.2 Creative goods and services and 7.3 Online creativity – were also assigned a weight of 0.5.
Strengths and weaknesses
Strengths and weaknesses are calculated for all economies covered in the GII and are presented in the individual economy profiles (see the explanatory section Economy profiles) and in the GII Economy briefs available through the GII Innovation Ecosystems and Data Explorer. In simple terms, strengths and weaknesses are the top- and bottom-ranked indicators for each country. In addition, income group strengths and weaknesses are also provided, which are the respective high- and low-performing indicators within income groups.
The methodology for the calculation of strengths and weaknesses is as follows:
The scores of each indicator are converted to percentile ranks.
Strengths are defined as those indicators of an economy that have a percentile rank greater than or equal to the 10th percentile rank (across the indicators of that economy). This can result in more than 10 strengths in the event of tied results.
Weaknesses are defined in an equivalent manner for the bottom 10 indicators.
If a country has an indicator that ranks equal to or lower than three, it is automatically a strength, regardless of the percentile rank.
Importantly, although the cut-off value used to define the strengths (i.e., the 10th highest percentile rank) is calculated using only indicator percentile ranks, it is also applied to sub-pillars and pillars.
In addition, for pillars and sub-pillars that do not meet the Data Minimum Coverage (DMC) criteria, strengths and weaknesses are not signaled. Pillars and sub-pillars that do not meet the DMC are presented in brackets in the economy profiles.
Income group strengths and weaknesses are like the overall strengths and weaknesses, but defined within income groups and use means and standard deviations. The methodology for calculation is as follows:
For a given economy, income group strengths are those scores that are above the income group average plus the standard deviation within the group.
For that economy, weaknesses are those scores that are below the income group average minus the standard deviation within the group.
The only exceptions to the income group strengths and weaknesses are the top 25 high-income economies, where these strengths and weaknesses are computed within the top 25 group only.
As the only non-high-income economy in the top 25, China's income group strengths and weaknesses are computed relative to the non-top 25 group.
Since, occasionally, the low threshold for weaknesses is below zero, any score of zero is automatically marked as a weakness.
Finally, as of 2023 and following the recommendation of the audit by the WIPO Internal Oversight Section,
(6)IOD Ref: IA 2022-03, April 14, 2023: https://www.wipo.int/documents/d/about-wipo/docs-en-oversight-iaod-audit-audit-gii.pdf. strengths and weaknesses are reset, or not signaled, where the data year for a given indicator is older than the indicator mode minus five years. In practice, for the GII 2025, this means that for indicators with a data year mode of 2024, the data year of an economy must be 2019 or later to qualify as a strength or weakness.
Caveats on the year-to-year comparison of rankings
The GII compares the performance of national innovation systems across economies and presents the changes in economy rankings over time.
It is important to note that scores and rankings are not directly comparable between one year and another. Each ranking reflects the relative position of a particular economy based on the conceptual framework, the data coverage and the sample of economies of that specific GII iteration and reflects changes in the underlying indicators at source and in data availability.
Several factors influence the year-on-year rankings of an economy:
the actual performance of the economy in question;
adjustments made to the GII framework (changes in indicator composition and measurement revisions);
data updates, the treatment of outliers and missing values; and
the inclusion or exclusion of economies in the sample.
Additionally, the following characteristics complicate the time-series analysis based on simple GII rankings or scores:
Missing values: The GII produces relative index scores, which means that a missing value for one economy affects the index score of other economies. Because the number of missing values decreases every year, this problem reduces overtime.
Reference year: The data underlying the GII do not refer to a single year but to several years, depending on the latest available year for any given indicator. In addition, the reference years for different indicators are not the same for each economy, due to measures to limit the number of missing data points.
Scaling factors: Most GII indicators are scaled using either GDP or population, with the intention of enabling cross-economy comparability. However, this implies that year-on-year changes in individual indicators may be driven either by the variable (numerator) or by its scaling factor (denominator).
Consistent data collection: Measuring the change in year-on-year performance relies on the consistent collection of data over time. Changes in the definition of indicators or in the data collection process could create movements within the rankings unrelated to performance.
A detailed study at the economy level based on the GII database and the economy profiles over time, coupled with analytical work on the ground, including that of innovation actors and decision-makers, yields the best results in terms of monitoring an economy's innovation performance, as well as identifying possible avenues for improvement.