Global Innovation Tracker Dashboard
The Global Innovation Index (GII) 2025 Tracker takes the pulse of innovation against a backdrop of mixed economic conditions, ongoing technological breakthroughs and evolving regulatory frameworks shaping how ideas emerge, spread and scale globally. The GII Tracker does this by analyzing four areas in particular: science and innovation investment, technological progress, technology adoption, and the socioeconomic impact of innovation.
All four areas analyzed by the GII 2025 Tracker – exceptions aside – generally show uneven but across-the-board growth covering investment, technological progress, adoption and socioeconomic impact. Compared to previous GII editions, where results were more mixed, with some pillars in decline, this year the picture appears more uniformly positive. Only three indicators were in decline in GII 2025: venture capital (VC) deal counts, drug launches and global warming. This is an encouragingly positive development. In contrast, previously in the GII 2024, five indicators had declined and in the GII 2023, seven.
That said, deeper analysis reveals a persistent slowdown over time: innovation investments have significantly decelerated, R&D growth has declined to its lowest point since 2009 (a historic moment in which R&D actually went into decline), VC is continuing to contract, and the rebound in patenting is tepid. Overall, five out of 24 indicators have grown above the long-term (decade) trend, while 19 have fallen below.
A summary of the findings of the Global Innovation Tracker 2025, by the four key stages of the innovation cycle, is as follows.
1. Science and innovation investment
Following a sharp downturn in 2023, science and innovation investment showed only a partial and uneven recovery in 2024. Only one indicator – scientific publications – is above trend; the rest, including R&D, VC, and patents, are below.
Following a sharp downturn in 2023, science and innovation investment showed only a partial and uneven recovery in 2024. Only one indicator – scientific publications – is above trend; the rest, including R&D, VC, and patents, are below.
Global R&D growth continued to slow – down to 2.9 percent in 2024 and projected to fall further to 2.3 percent in 2025 – marking the weakest expansion in over a decade. R&D spending among top global firms also rose only by 3 percent in nominal terms, well below the decade average of 8 percent. Whereas sectors such as ICT hardware and services, software, and pharmaceuticals have experienced robust R&D growth of around 10 percent, other key industries, such as automotive and consumer goods, have seen declining revenues constrain R&D budgets.
Venture capital, once expected to rebound in 2024 after a 2023 collapse, remains stuck in a prolonged slowdown. While VC deal values increased by 7.7 percent – driven largely by a handful of US-based megadeals, particularly related to artificial intelligence (AI) – the total number of deals declined by 4 percent. Similarly, after a period of internationalization during the post-COVID years 2021 and 2022, including to new markets (Africa and Latin America) and to a broader set of sectors, the VC landscape is becoming more concentrated on the United States of America (US) and information technology (IT) and AI-related sectors.
This marks a reversal of the broader and more sectorally diverse VC distribution seen in 2021 and 2022.
2. Technological progress
Indicators of technological progress remained largely positive in 2024. Supercomputer efficiency and electric battery prices outperformed the long-run trend, whereas the rest fell short. Computing power advanced in line with Moore's Law, while the energy efficiency of top green supercomputers improved markedly. The cost of renewable energy technologies – solar and wind – and lithium-ion batteries continued to decline, sustaining the green transition.
In health innovation, however, trends were mixed: the cost of genome sequencing decreased, but at a slower rate than in the past, and the number of new drug launches fell, marking a reversal from previous highs. Overall, progress remained sectorally uneven – buoyant in digital and green technologies, but fragile in health innovation compared to 2021 and 2022, which saw COVID-induced health innovation peaks.
3. Technology adoption
The uptake of key technologies continued across most indicators in 2024, though growth rates slowed relative to the decade average. Overall, all indicators fell below the long-term trend, with electric vehicles (EVs) showing a 10 percentage point gap below trend.
Electric car adoption decelerated significantly in major Western markets, with annual growth rates falling by around 30 percentage points. By contrast, China and other emerging economies, such as India, Viet Nam and Brazil, sustained strong EV growth. Connectivity continued to improve, with 5G coverage reaching half the global population, yet disparities remain stark.
Industrial robotics and high-speed rail infrastructure, in turn, saw gains below the decade average, with China almost single-handedly driving high-speed network progress globally. Furthermore, the availability of cancer therapy equipment improved marginally, while safe sanitation coverage continued to expand. In sum, technology adoption persisted, but slowed, particularly in high-cost or infrastructure-intensive areas.
4. Socioeconomic impact
In 2024, socioeconomic outcomes showed continued post-pandemic recovery. Two indicators – labor productivity and life expectancy – are above trend, whereas poverty and global temperatures are below (worsening). Labor productivity rose 2.5 percent – a notable increase from last year. Life expectancy reached a record high, and extreme poverty continued to decline, though progress remained sluggish.
Yet, a major source of concern remains: global temperatures reached their highest recorded level in 2024, approximately 1.3°C above the 1951–1980 baseline, underscoring the growing climate challenge and possibly insufficient use of innovation to combat climate change. Carbon dioxide emissions from fossil fuels grew by an estimated 0.8 percent from 2023 to 2024, reaching a new high after a temporary 6 percent drop in 2020. However, the growth rate is below the 1.7 percent annual average since 1994, and emissions are declining in most major emitting countries.
Science and innovation investment
Innovation investment weathered the immediate COVID-19 disruption with remarkable dynamism, achieving historic peaks in VC funding by 2021. However, this resilience proved temporary, as multiple headwinds converged in 2022, triggering a prolonged contraction that deepened significantly throughout 2023. The year 2024 signaled a tentative and uneven recovery amid persistent underlying weaknesses across key innovation metrics. As a result, most GII 2025 indicators relating to innovation investment stayed well below pre-pandemic performance levels, with projections for 2025 suggesting continued weakness and the lowest growth rates on record since 2010.
Scientific publications
The growth of scientific publications tumbled after the COVID-19-induced publication peak in 2021 of 1.95 million. Publication growth fell from 8.5 percent in 2021 to 3.3 percent in 2022, and declined by 5 percent in 2023 (see Figure 1). In a turn-around, in 2024, the number of articles published rose by 5.6 percent, marking a new yearly record of close to 2 million scientific publications. Among the countries driving this recovery, China stood out with a 14 percent increase in publications, accounting in 2024 for 26 percent of the global total. India followed with a 7.7 percent growth rate and a 4 percent global share.
Growth was more moderate among other major economies. The United States recorded a 1.3 percent increase, maintaining a 12 percent share of global publications. The United Kingdom grew by 3 percent, holding a 4 percent share, while the Republic of Korea registered 4 percent growth, contributing 2.4 percent of the total.

Research and development (R&D)
Economy-wide R&D expenditure
The most recently available data show that – after a steep fall in R&D expenditure in 2020 followed by a reboot in 2021 and 2022, global R&D growth slowed to 4.4 percent (in real terms) in 2023 (Figure 2). This is down from 4.7 percent in 2022, and below the pre-pandemic growth rate of 6.3 percent in 2019.
Estimates for 2024 and 2025, based on projected GDP growth, present a scenario that is worse still, with global R&D growth expected to slow further to less than 3 percent in 2024 (2.9 percent) and only 2 percent in 2025 (2.3 percent). Similarly, business R&D is projected to slow down, growing at a similar rate to total R&D – that is, at 2.9 percent in 2024 and 2.3 percent in 2025, and only at 1.4 percent in both 2024 and 2025, when excluding the China and the United States from projections.
If these estimates prove correct, they would be the lowest growth rates on record since 2010 – the year after the financial crisis and the ensuing Great Recession. Business R&D growth would also be at the same level as the growth rate for total R&D expenditure; a situation that has not been observed since the early 2000s (see Figure 2). R&D expenditure growth would also stay well below GDP growth, a situation that last occurred in 2010.

Top corporate R&D spenders
On the corporate side, 2024 R&D data is available for 1,510 of the top 2,000 corporate R&D spenders globally (
In 2024, corporate R&D expenditure stood at almost USD 1.3 trillion – a historic high – up by around 3 percent in nominal terms, but only about 1 percent in real terms due to persistently high inflation (see Table 1).
Despite representing a historic peak in absolute terms, this marks the slowest annual nominal growth in corporate R&D spending since 2010.
The subdued growth in R&D investment occurred alongside a decline in the aggregate revenues of large, R&D-intensive multinational firms. In 2024, the combined revenue of these firms dropped by nearly 1 percent in nominal terms and 2.7 percent in real terms. This marks a second consecutive year of negative revenue growth, reversing the strong post-pandemic earnings rebound observed in 2021 and 2022.
Because revenue growth declined more than did R&D spending growth, R&D intensity rose from 5.3 percent in 2023 to 5.5 percent in 2024 – its highest level since 2018, when it stood at 4.5 percent.

However, aggregate R&D spending growth across the top 1,500 firms masks important sectoral and firm-level differences. Some IT and pharmaceutical firms continued to grow their R&D investments, while others in the same sectors registered a steep decline. Significant variation was also observed across industries – for instance, the automotive sector experienced a substantial reduction in R&D investment.
Figure 3 illustrates divergent R&D investment trajectories across key industries since 2018. On average, Software and ICT services stands out with robust growth, more than doubling its 2018 R&D by 2024 and recording strong revenue growth of 10 percent in 2024. Construction and industrial metals followed, with solid gains through 2023 before declining in 2024. Pharmaceuticals and biotechnology and ICT hardware and electrical equipment also posted consistent, though more moderate, R&D growth over the period. In contrast, Automobiles and travel, Leisure and personal goods lagged significantly in terms of growth over the period and underwent a decline in 2024.
The fall in R&D spending in Automobiles, Construction and industrial metals, and Travel, leisure and personal goods in 2024 was accompanied by a contaction in revenue of approximately 3.5 percent, 6 percent, and 2.5 percent, respectively. Additionally, the Oil and Gas sector – which accounts for a substantial share of total revenue among top R&D spenders – recorded a notable 5 percent drop in revenue.
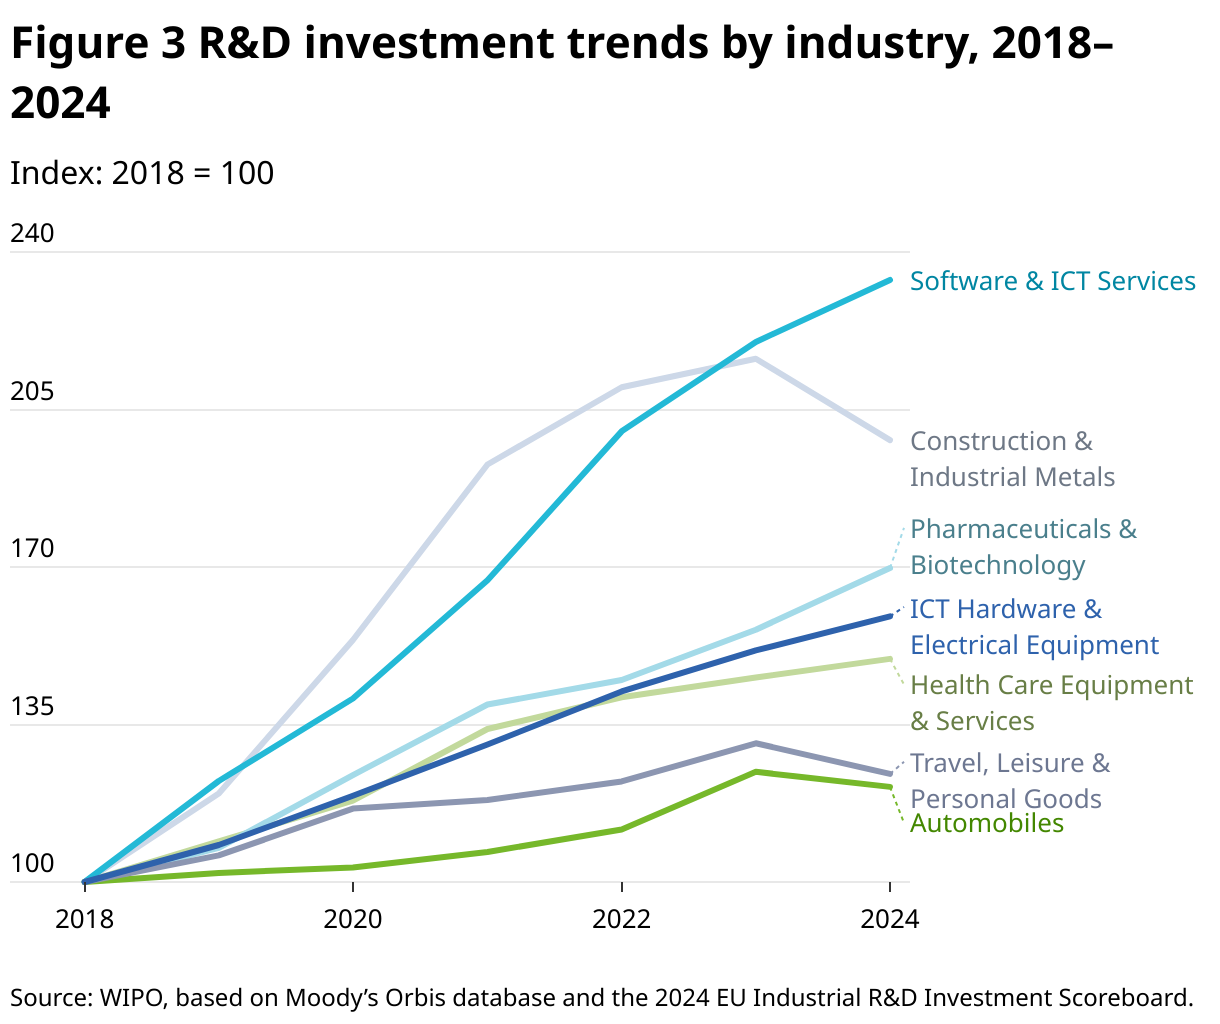
In terms of R&D investment share by industry, the overall composition remained relatively stable over 2018–2024. Software and ICT services modestly increased its share of total R&D spending from 14 percent in 2018 to more than 20 percent in 2024. Automobiles, on the other hand, saw a steady decline over the same period, from more than 18 percent to roughly 14 percent. Shares across all other sectors remained broadly stable.
R&D intensity also shows marked differences across industries. Pharmaceuticals and biotechnology consistently recorded the highest intensity, increasing from nearly 16 percent in 2018 to 19 percent in 2024. Software and ICT services followed at 14 percent. ICT hardware and electrical equipment reached 8 percent, and the Automobile industry stood at 5 percent. Other industries reported R&D intensities ranging between 2 and 4 percent.
In geographical terms, the United States accounted for nearly half of total spending (47 percent), with 556 firms in the sample. Asia follows with a 30 percent share, driven primarily by firms in China (about 18 percent), Japan (about 7 percent) and the Republic of Korea (about 3 percent). Europe contributed 22 percent to global R&D expenditure, with Germany leading the region at 8 percent.
Figure 4 shows the nominal percentage change in R&D expenditure for 2024 among the top 15 in each of the top eight industries. While most firms continued to increase investment, sustaining the positive trend of recent years, 30 companies cut R&D spending. Average growth was negative in Automobiles (–2.7 percent), Construction and industrial metals (–8.4 percent), and Travel, leisure and personal goods (–5.2 percent). In Software and ICT services, three of the top 15 R&D spenders reduced investment, whereas only one firm in Pharmaceuticals and biotechnology did so. In the Automobile sector, six out of the 15 leading firms decreased R&D expenditure.
Some highlights:
In ICT hardware and electrical equipment, the Broadcom company recorded the largest growth (+77.2 percent), followed by NVIDIA, Samsung Electronics, and SK Hynix.
Meta still leads in Software and ICT services, with a growth rate of 14 percent.
In Pharmaceuticals and biotechnology, AbbVie posted a 67 percent increase, well above other companies in the sector, such as Bristol-Myers Squibb (20 percent) and AstraZeneca (19 percent).
R&D spending declined for several major automobile firms, including Stellantis (–8.4 percent), General Motors (–7.1 percent), Volkswagen (–3.6 percent) and Mercedes-Benz (–2.8 percent). By contrast, Tata Motors, BYD, BMW, Honda, and Tesla registered the most growth within the industry.
Venture capital
In 2024, VC deal values rose by 7.7 percent, following upon a significant market correction in 2022 and 2023, when deal values declined by 30 percent each year. These declines marked a sharp reversal from the historic boom of 2021, during which VC deal values almost doubled to reach a peak of USD 750 billion. Despite the modest recovery, total deal values in 2024 reached USD 384 billion – still well below the 2021 level (Figure 5).
In contrast to the rebound in deal values, the number of VC deals continued to decline in 2024, falling by 4.4 percent to around 43,000 deals – down from a high of approximately 58,000 in 2021. This marks a third consecutive year of declining deal volume.
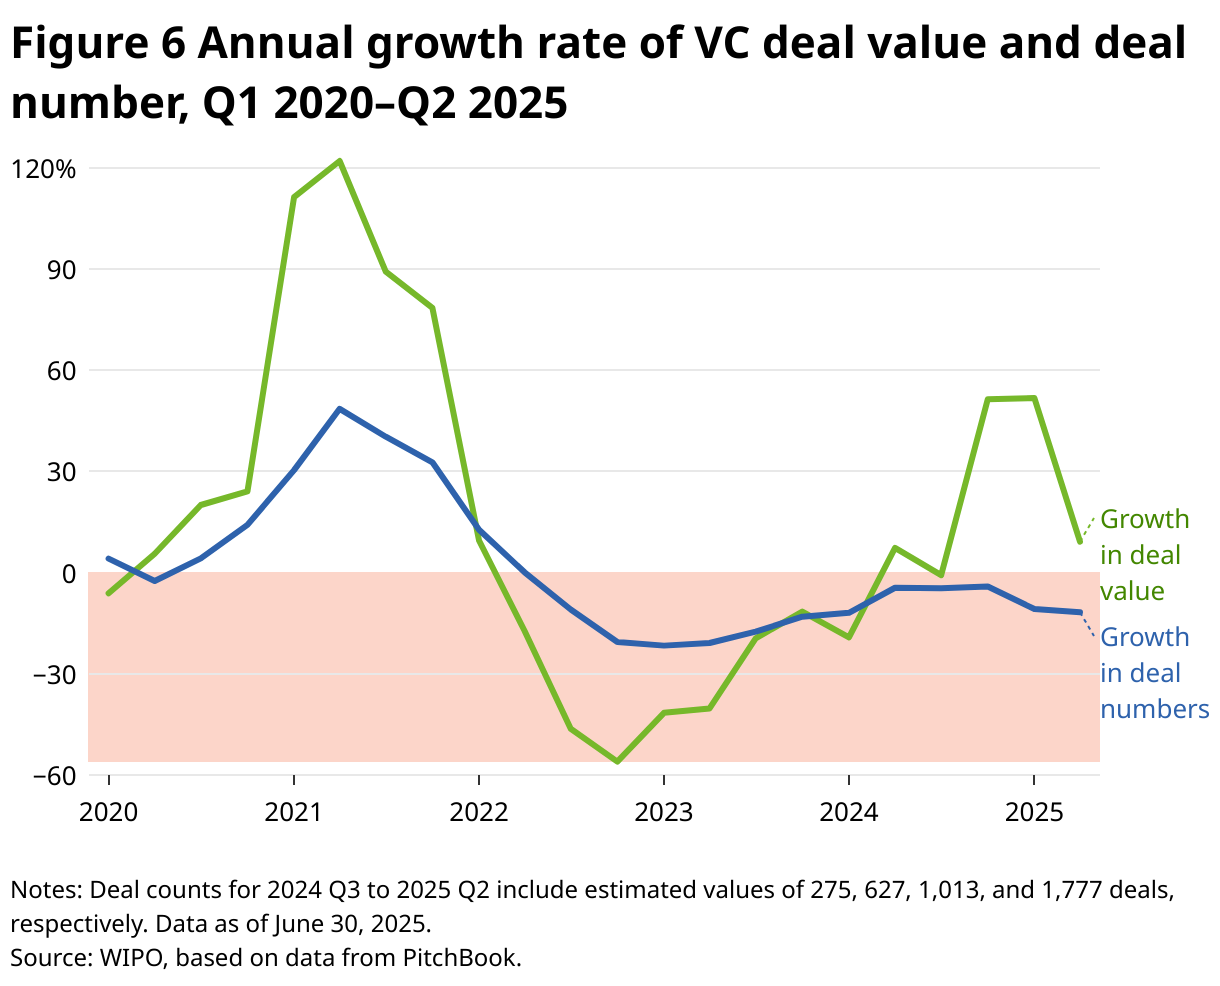
Quarterly data confirms these trends. In Figure 6, we compare each quarter to the same quarter in the previous year. Deal values have been declining since Q2 2022, falling consistently from Q3 2022 onward. However, this negative trend was reversed in 2024, when values increased by 7 percent in Q2, followed by a 50 percent rise in both Q4 2024 and Q1 2025, and a further 9 percent increase in Q2 2025. In contrast, the number of VC deals has continued to decline steadily since Q2 2022, recording an 11 percent year-on-year drop in Q2 2025.
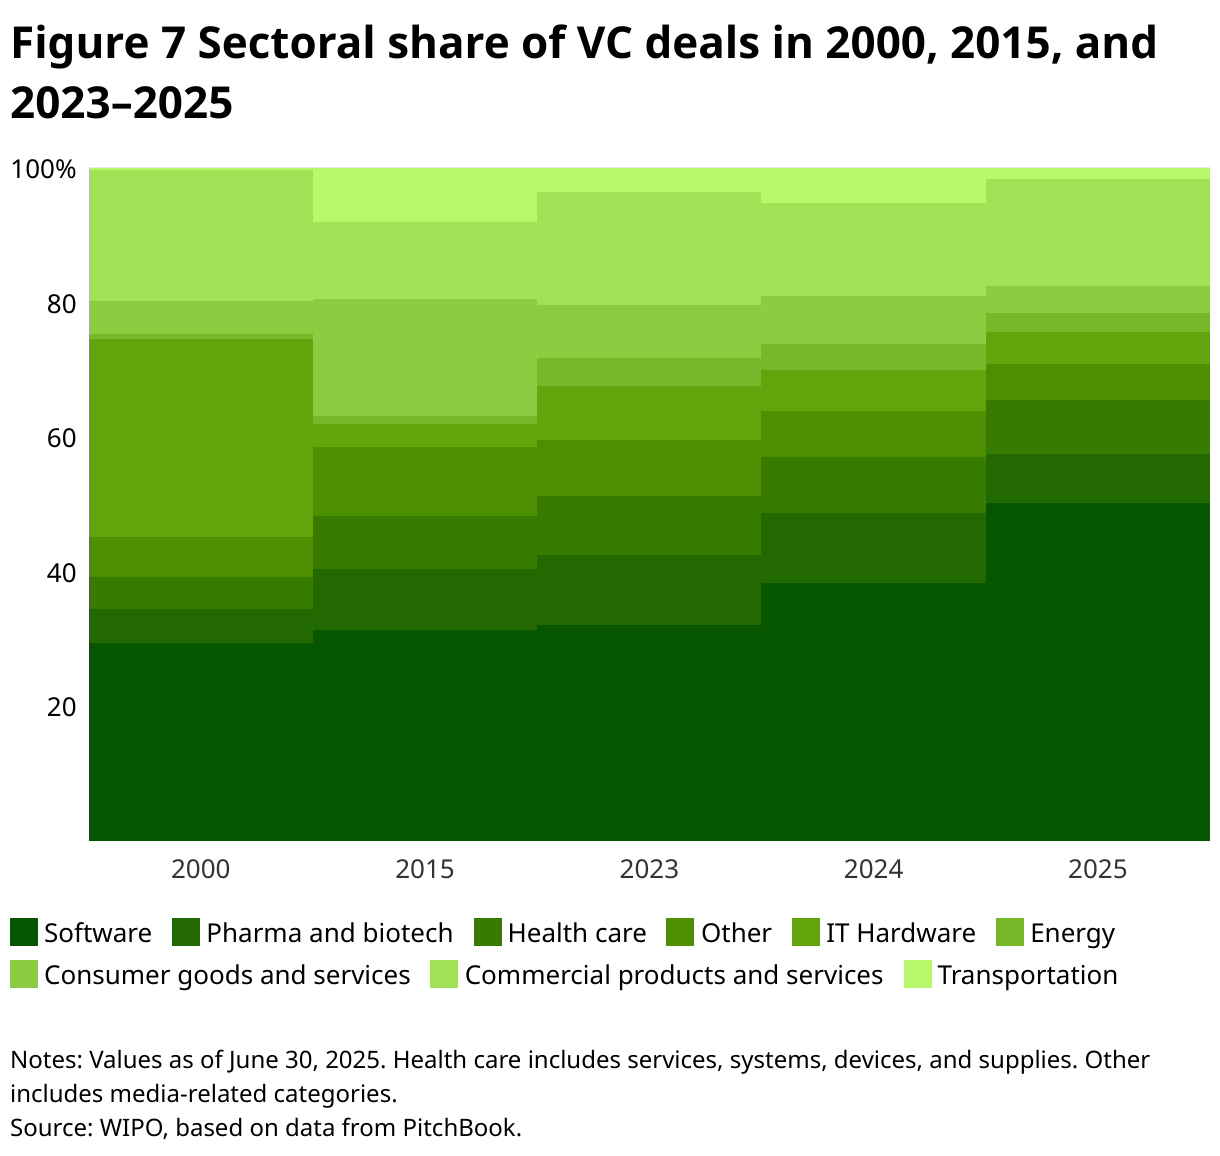
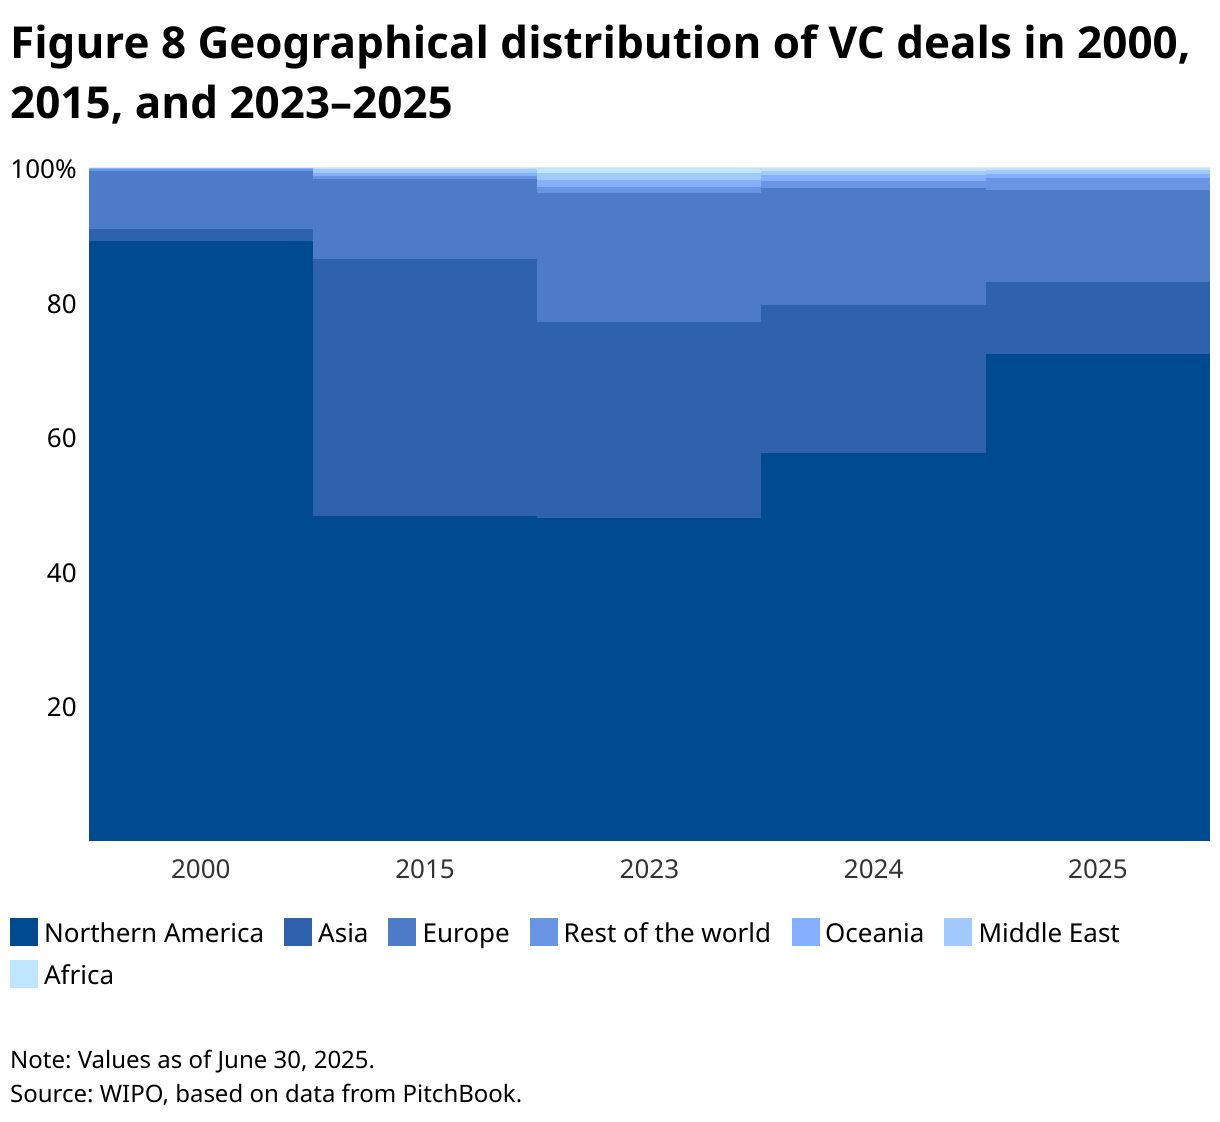
Figures 7 and 8 provide a detailed view of sectoral and geographical trends in VC investment, shedding light on the structural shifts that have occurred over the past three decades, and on the recent surge in deal values. They display the share of total VC by sector and by region for the years 2000, 2015 and then from 2023 until 2025.
From 2000 to 2023, VC investments became increasingly diversified across sectors. During this period, IT hardware saw a notable decline in its share of total VC deal value, while sectors such as energy and health care gained a larger portion of investment. Software, meanwhile, maintained a stable share at around 30 percent. However, a trend toward reconcentration emerged after 2023, culminating in 2025, when the software sector accounted for half of all VC funding – a historic peak.
A similar pattern emerged geographically. In 2000, Northern America accounted for nearly 90 percent of global VC investment. Over the following two decades, regional distribution became more diverse, reaching a peak in 2023, when Northern America's share declined to 48 percent, Asia's rose to 29 percent, Europe's reached 19 percent, and the other regions held 1 percent each. However, by 2025, Northern America had regained its lead, with a 72 percent share.
The sectoral and geographical reconcentration of VC within the United States, along with a recent surge in deal values throughout 2024 and into the first half of 2025, is largely driven by substantial investments in AI. This sector has experienced remarkable growth over recent years, with its share of total deal value rising from around 20 percent in Q4 2022 (when ChatGPT was launched) to 56 percent in Q1 2025 and 49 percent in Q2 2025.
In 2024, deals involving major AI-related companies – Databricks, OpenAI, xAI, Anthropic, and Waymo – totaled around USD 40 billion, accounting for approximately 10 percent of the year’s total deal value. This trend accelerated in the first quarter of 2025, when three of the largest VC rounds – OpenAI (USD 37 billion), Anthropic (USD 3.3 billion), and Infinite Reality (USD 2.8 billion) – represented more than 30 percent of all VC raised that quarter. Without these megadeals, VC investment in 2024 would have fallen by more than 3 percent year on year, and the first quarter of 2025 would have been just one percentage point above the figure from a year earlier, instead of 51 percent (see Figure 6).
International patent filings
International patent filings saw a cautious return to growth in 2024, with global applications reaching 273,900 under the Patent Cooperation Treaty – a modest 0.5 percent increase on the previous year, according to WIPO's latest data.
The filing landscape revealed notable regional variations among leading applicants. China maintained its position as the top filer, with a close to 1 percent increase, contributing one-quarter of global applications in 2024. The Republic of Korea demonstrated exceptional momentum, with a 7.1 percent growth rate , too, extending its impressive 27-year streak of continuous expansion. Conversely, three major patent jurisdictions – the United States, Japan and Germany – collectively representing over 40 percent of total applications – experienced declines of 2.7 percent, 1.2 percent, and 1.3 percent, respectively.
Technological progress
Technological advancement indicators in 2024 demonstrated strong momentum across multiple critical sectors, reflecting continued innovation investment and well-established technological trajectories. In sum, all underlying technological progress indicators – aside from some exceptions in the field of health – reflect robust technological progress driven by sustained innovation, competitive dynamics and an expanding global capacity across the computing, energy and biotechnology domains.
Computing power
Green supercomputers
The GII 2025 Tracker evaluates supercomputer performance based on the number of Gigaflops achieved per Watt of energy consumed. Between 2023 and 2024, the average efficiency of the top 50 "greenest" supercomputers increased by more than 65 percent, far exceeding the decade's compound annual growth rate of 35 percent. On average, supercomputers are becoming greener by this standard.
However, it is important to note that such efficiency gains are largely driven by an increase in computing power rather than a reduction in energy usage. Supercomputers remain exceptionally energy intensive.
At the same time, supercomputer performance – measured by actual maths-processing speed – has shown signs of slowing down.
Moore's Law
Between 2023 and 2024, the transistor-count in microchips increased by approximately 37 percent, slightly below the 42 percent annual growth rate implied by Moore's Law. This, however, is not particularly surprising, given that a two-year interval between major hardware advancements is quite typical, and 2023 had already seen the release of numerous high-end hardware innovations. Moreover, the 10-year growth rate remains precisely at 42 percent, aligning perfectly with Moore's Law.
Cost of renewable energy
Between 2022 and 2023, the global weighted-average levelized cost of electricity (LCOE) from newly commissioned solar photovoltaic (PV) – that is, the average lifetime cost of producing one unit of electricity – decreased by 12.4 percent. During the same period, the LCOE for both onshore and offshore wind also declined, but by a smaller margin of 3.4 percent.
In 2010, the cost of generating one unit of electricity from solar PV was 410 percent higher than the cheapest fossil fuel option. Since then, solar PV costs have plunged by 90 percent, making solar-generated power today 56 percent cheaper than fossil fuels. For onshore wind, costs were nearly 23 percent higher in 2010, but are now 67 percent lower, marking a total LCOE decrease of 70 percent. Offshore wind has also made significant progress in closing the gap with fossil fuels, with costs dropping from 126 percent higher than oil in 2010 to 25 percent lower today, representing a 60 percent decrease.
Electric battery price
Lithium-ion battery pack prices dropped 20 percent from 2023 to a record low of real USD 115 per kilowatt-hour in 2024. Factors driving this decline include cell manufacturing overcapacity, economies of scale, lower metal and component prices, the adoption of lower-cost lithium-iron-phosphate batteries, and a slowdown in EV sales. This represents a global average, with prices varying widely across countries and application areas.
The lithium-ion battery value chain is highly dynamic, with lithium extraction booming and battery costs plunging. As Figure 10 shows, prices have dropped by 85 percent since 2013, while at the same time lithium production has increased by more than 550 percent.
Cost of genome sequencing
Between 2022 and 2024, the cost of genome sequencing declined at an annualized rate of 11.1 percent – a slower pace compared to the long-term rate of –21.5 percent. Over the past two decades, the cost of sequencing a whole human genome has dropped dramatically, from approximately USD 100 million in 2001 to just over USD 500 in 2023 (based on US estimates). Some companies report even lower costs ranging from USD 200
Industry experts also note that Chinese firms have rapidly expanded their sequencing capacity, with projections that the cost of sequencing could drop to as low as USD 10 per genome within the next three years – driven by advances in automation, AI-powered analysis, and innovations in sequencing chemistry.
However, these figures typically only reflect the cost of consumable materials and exclude major expenses such as equipment, maintenance and labor. They represent internal research or laboratory costs – not the final price paid by health care providers and researchers.
Significant disparities exist across the regions. In Africa, sequencing costs are estimated to be 2–3 times higher than in the United States, primarily due to import tariffs, limited reagent availability, and high logistical costs. Transporting biological samples across African countries remains particularly challenging, with shipping costs reportedly reaching up to USD 4,500 per shipment – posing a serious barrier to large-scale genomic research.
Despite these obstacles, the data indicate an intense global race to lower genome sequencing costs, driven by rapid technological advances and heightened industry competition. Dramatic cost reductions have significantly broadened access to sequencing technologies, enabling more accurate disease diagnosis, improving crop development, and accelerating the creation of precision therapies.
Drug approvals
In 2024, 65 novel active substances (NASs) were launched globally, representing a close to 19 percent decrease from the previous year's total of 80, and the record high of 93 recorded in 2021.
Oncology remained the leading therapeutic area in 2024, accounting for 25 of the year's NAS launches. Neurology followed with nine, while hematology and endocrinology each saw the introduction of seven new drugs. Notably, this year's launches included several breakthrough treatments, such as the first schizophrenia drug in over 30 years, the first approved therapy for MASH (a serious liver disease linked to metabolic dysfunction), four medicines for rare neurological conditions, and seven non-cancer blood disorder treatments, including two gene therapies. The data also show the long and complex journey toward drug development. In 2024, over three-quarters of newly launched drugs took more than 10 years to reach the market, with a median development timeline of 14 years.
Technology adoption
In 2024, technology adoption continued to grow across all indicators, though at a slower pace than for the past decade. Growth remained evident in robotics and connectivity; high-speed rail networks, a new indicator, expanded. In turn, robot and EV adoption experienced a marked slowdown. Also, the technology diffusion challenges in the field of safe sanitation and providing sufficient cancer therapy equipment identified in 2023 persisted in 2024.
Safe sanitation
In 2024, 58 percent of the world's population used safely managed sanitation services, up from 47 percent in 2014. This progress means that over one billion people have gained access to these essential services in the past decade.
India and China, which together account for more than one-third of the global population, have made notable strides – each recording an increase of around 23 percentage points since 2014. Usage rates for safe sanitation now stand at 69 percent in China and 63 percent in India. The rate in Romania has increased by 21 points, nearing universal usage, and Egypt recorded a 26 percentage point jump.
Despite these advances, current trends suggest that by 2034, around 30 percent of the global population will still not have access to safely managed sanitation.
Connectivity
Fixed broadband subscriptions grew by over 6 percent in 2024, with penetration rates reaching nearly 20 subscriptions per 100 inhabitants.
By contrast, mobile broadband access is far more widespread, with high-income economies reporting 153 subscriptions per 100 inhabitants, followed by 112 in upper middle-income economies, 66 in lower middle-income economies, and 40 in low-income economies.
Since the start of commercial deployment in 2019, 5G coverage has expanded rapidly. By 2024, it reached approximately half of the global population, representing an annual growth rate of more than 50 percent since 2020. Despite this progress, significant disparities remain in the quality of access. In 2024, 84 percent of the population in high-income economies had access to 5G, compared to just 4 percent in low-income economies (see Figure 11). Additionally, nearly 20 percent of people in low-income economies still lack any form of mobile connectivity, and another 28 percent rely solely on 3G, which significantly limits their online capabilities.

Robot adoption
The global stock of industrial robots grew by just under 10 percent in 2023 – over five percentage points lower than the growth rates observed in 2021, 2018 and 2017. Despite this slowdown, projections point to a steady compound annual growth rate of 4 percent in new robot installations, reaching more than 600,000 units by 2027. Meanwhile, major economies have collectively committed more than USD 60 billion to public R&D programs in robotics, signaling continued long-term investment in the field.
Although the growth of the global industrial robot stock slowed in 2023, the overall pace of adoption has accelerated markedly since 2010. Between 2000 and 2010, the global stock of robots expanded in line with the world economy, growing at an average annual rate of approximately 3.5 percent. However, since 2010, this relationship has shifted: while global economic output has continued to grow at a modest rate of about 3 percent per year, the number of robots per worker has increased at a much faster pace – surpassing a compound annual growth rate of 10 percent.
In 2023, the countries with the largest operational stock of robots were China (41 percent of the global total), Japan (10.2 percent), the United States (8.9 percent), the Republic of Korea (8.9 percent) and Germany (6.3 percent). Meanwhile, rapid advancements in AI-powered behavior cloning, whereby robots learn tasks by observing repeated human demonstration, are expected to broaden the range of robotic applications and further accelerate adoption.
Electric cars
The global stock of electric cars grew by 18 million units in 2024 – a significant 45 percent increase over 2023. However, this growth rate shows signs of slowing when compared to the annualized long-run growth rate over the past decade, which averaged around 55 percent. Several major markets experienced a sharp slowdown in electric car stock growth in 2024.
As of 2025, 4.5 out of every 100 cars worldwide are electric, a significant increase from just 0.07 per 100 a decade ago. As shown in Figure 12, Scandinavian countries lead in EV penetration, with Norway at 32 electric cars per 100, followed by Iceland (18), Denmark (17), and Sweden (13). Close behind are the Belgium, China and the Kingdom of the Netherlands, each with approximately 11 electric cars per 100. Looking ahead, despite rapid innovation and diffusion, the sector might face some headwinds in 2025. In the United States, EV demand is expected to slow.

High-speed rail network
To capture the diffusion of transportation technology, the GII 2025 Tracker includes, for the first time, data on high-speed rail networks – measured as the total length of operational high-speed rail lines worldwide. Between 2022 and 2023, the global network expanded by 5 percent, which is below the annual growth rate of 9 percent for the decade .
Since Japan pioneered this technology by laying 515 km of track in 1964, high-speed rail has expanded dramatically across the globe. Italy followed in 1977, France in 1981, and Germany and Spain in the 1990s. The most remarkable growth, however, has taken place in China. Figure 13 shows the global high-speed rail network length, along with a projected trend based on data from 1990 to 2008 – the year China's first high-speed line became operational. That year marks a clear inflection point: since 2008, China has added approximately 45,400 km of high-speed rail to its network. This expansion accounts for the majority of the gap between the historical trend and the actual global total, with roughly 70 percent of the world's high-speed rail now within China.
Today, roughly 5,000 high-speed trainsets operate daily worldwide, transporting 2 billion passengers annually. Expansion continues, with thousands of kilometers of new rail lines under construction across the globe, including in India, Morocco, Thailand, Türkiye, the United Statesand elsewhere.

Cancer radiotherapy
To capture the adoption of health-related technology, the GII 2025 Tracker provides information on the availability of cancer therapy equipment, specifically the number of linear accelerators (LINACs) – devices for delivering high-energy x-rays or electrons to cancers for therapeutic or palliative purposes – per inhabitant.
Data for 2024 show an around 1.3 percent increase in the availability of LINACs per capita compared to the previous year, which is below the average annual global increase in LINAC availability of 1.8 percent over the past decade.
In 2024, 25 out of 100 countries met the minimum radiotherapy requirements set out by the International Atomic Energy Agency (IAEA) DIrectory of RAdiotherapy Centres (DIRAC) (see Data note). Among high- and upper middle-income economies, there has been a notable increase in the percentage of economies meeting radiotherapy requirements. However, the number of lower middle- and low-income economies meeting radiotherapy technology minimum requirements remains low, indicating a persistent divide in access to adequate radiotherapy services.
Socioeconomic impact
In 2024, indicators of the socioeconomic impact of innovation showed continued recovery from the COVID-19 shock. Labor productivity increased slightly above the decade average, hinting at emerging benefits from recent innovation waves. Extreme poverty declined, though regional gaps remained. And life expectancy reached a new record high. However, progress stalled on when it comes to the climate: emissions have rebounded after a temporary pandemic-related decline, with pollution rising steadily post-reopening.
Labor productivity
Between 2023 and 2024, output per hour worked increased by 2.5 percent, closely aligning with the compound growth rate of 2.2 percent over the past decade. Productivity reached nearly 55,000 USD (PPP, constant 2024 prices) per worker – almost 10,000 USD more than a decade ago.
The countries that experienced the fastest productivity growth from 2014 to 2024 were China (at 5.9 percent), Viet Nam (5.4 percent) and Ethiopia (5 percent), all annualized rates. Among the top growers it is worth mentioning African countries Burkina Faso (at 4.8 percent), Kenya (3.3 percent) and Rwanda (3.3 percent), as well as Asian countries Bangladesh and India at 4.5 and 4.3 percent, respectively. Such rapid productivity growth is particularly important, given that many of these countries have large populations andtheir economic progress therefore crucial for global development and poverty reduction.
Poverty
The global population living in extreme poverty, defined as those living on less than 3 USD (2021 PPP) per day, decreased by 0.6 percent in 2024 compared to the previous year, falling to 817 million This is under half of what it was 20 years ago, whent almost two billion people. were in extreme poverty.
Despite major global progress, regional disparities in poverty reduction remain stark (Figure 14). Between 2004 and 2024, the South Asia and East Asia and the Pacific – regions that, in 2004, had more than twice the level of extreme poverty of any of the other regions – achieved exceptional reductions, cutting extreme poverty by approximately 84 and 93 percent, respectively. In sharp contrast, poverty increased by 50 percent in Eastern and Southern Africa, and by 1.9 percent in Western and Central Africa. Meanwhile, in the rest of the world, poverty declined by 45 percent over the same period.

Life expectancy
Average life expectancy at birth increased by 0.7 percent in 2023, following a stronger rebound of 2.5 percent in 2022. These gains came after two consecutive years of decline during the peak of the COVID-19 pandemic, with life expectancy falling by 1 percent in 2020 and 1.5 percent in 2021. Over the past few decades, life expectancy has shown a steady upward trend. In 35 years, global average life expectancy at birth has increased by 10 years. A person born in 2023 can now expect to live an average of 73 years (females: 76, males: 70) – up from 63 years (females: 66, males: 61) in 1988.
That said, a possibly better measure of an innovation-driven improvement in longevity is healthly life expectancy.
Global warming
Global temperatures in 2024 reached 1.29°C above the 20th-century baseline (1951–1980) and 1.56°C above the 1880–1920 baseline, surpassing the record set in 2023. These figures approach the upper limit of the 2°C target set by the Paris Agreement and exceed its more ambitious goal of limiting warming to 1.5°C above the pre-industrial level. This milestone follows an unprecedented 15-month streak of record monthly temperatures from June 2023 through August 2024.
Warming in 2024 varied by region: Northern America saw the highest land temperature increase (2.8°C), followed by Western Europe (2.7°C), Southern Europe (2.6°C), and Eastern Europe (2.4°C). The lowest increases were in Melanesia and Polynesia (1.2°C) and Middle Africa (1.3°C). Still, 163 of 237 countries and territories, representing 67 percent of the global population, experienced annual warming above 1.5°C.
Rising temperatures align with record-high global carbon dioxide emissions from fossil fuels. Between 2023 and 2024, emissions are estimated to have grown by 0.8 percent annually, setting a new high after a temporary 6 percent drop in 2020. However, there are signs of progress. The 2024 growth rate is well below the 1.7 percent annual average since 1994, and emissions from most major emitters are falling. China, responsible for 32 percent of global emissions, is projected to see only a slight rise of 0.2 percent, though a decrease remains possible. Emissions in the United States (13 percent of global total) are expected to fall by 0.6 percent, while the EU (7 percent) is projected to decline by a notable 3.8 percent. However, India (8 percent) stands out with a projected sharp increase of 4.6 percent.
Conclusion
The Global Innovation Index (GII) 2025 Tracker offers a comprehensive snapshot of innovation performance around the world. The GII Tracker evaluates innovation outcomes across the four stages of the innovation cycle: science and innovation investment, technological progress, technology adoption, and socioeconomic impact.
In 2024, innovation demonstrated overall resilience, despite a challenging environment. All four stages recorded progress, though gains were uneven and sector-specific. Science and innovation investment partially recovered from the sharp downturn of 2023, but remains subdued, with R&D growth projected to slow further in 2025. Technological progress was encouraging in digital and green technologies, but showed fragility in some health-related areas. Technology adoption continued, but at a slower pace, particularly in resect to cost-intensive or infrastructure-heavy innovations such as EVs and sanitation. Socioeconomic impacts improved – labor productivity and life expectancy increased; yet, climate indicators reached record highs, amplifying environmental concerns.
These findings highlight both progress and persistent vulnerabilities in the global innovation landscape. They suggest that in 2025, policymakers must balance, on the one hand, efforts to sustain innovation momentum, while, on the other, addressing emerging obstacles across the ecosystem. It is important to recall that the GII Tracker aims to capture broad innovation dynamics using a selective set of indicators. While investment measures are well-established, those relating to technological progress, adoption and impact remain selective and should be interpreted as indicative of wider trends rather than being exhaustive. Lastly, we hope that the GII, as an evolving tool, continues to stimulate debate on improving innovation metrics and policymaking.
Data notes
Scientific publications captures the number of peer-reviewed articles published across 182 fields of science and technology. Article counts are derived from journals indexed in the Social Sciences Citation Index (SSCI) and Science Citation Index Expanded (SCIE). Source: Web of Science (Clarivate), https://apps.webofknowledge.com.
R&D investment captures R&D expenditures worldwide in PPP-adjusted constant 2015 prices. The 2023 values were calculated using available real data of gross expenditure on R&D (GERD) and business enterprise expenditure on R&D (BERD) at the country level from the UNESCO Institute for Statistics (UIS) online database; the OECD’s Main Science and Technology Indicators (MSTI) database (March 2025 update); Eurostat and the Ibero-American and Inter-American Network of Science and Technology Indicators (RICYT). For those countries for which data were unavailable for 2023, the 2023 data were estimated using the last observation carried forward (LOCF) method for R&D intensities (R&D expenditures as a percentage of GDP) and applied to GDP PPP for the same year. R&D expenditures for 2024 and 2025 were estimated for all countries, using the latest available R&D intensity and estimations of GDP growth at constant prices from the International Monetary Fund, World Economic Outlook Database, April 2025.
Top corporate R&D spenders' 2018–2023 data is sourced from the European Commission's 2024 EU Industrial R&D Investment Scoreboard. The 2024 data is sourced from the Moody's Analytics Orbis database and from companies' annual reports. All figures are converted in current US dollars. Real R&D growth rates are calculated by first converting local-currency R&D figures into US dollars using market exchange rates at the end of the period and then deflating them using country-level GDP deflators. Growth rates are computed as weighted averages of firm-level growth, where weights are based on a firm's share in total nominal and real R&D spending in each year, respectively.
Venture capital (VC) refers to the number of VC deals worldwide. VC value refers to the total amount invested via venture capital, measured in current US dollars. Source: PitchBook Data, Inc, www.pitchbook.com.
International patent filings refers to the total number of patent applications filed through the WIPO-administered Patent Cooperation Treaty. Source: WIPO IP Statistics Data Center, www.wipo.int/ipstats.
Green supercomputers captures the average efficiency of the top 50 systems in the Green500 list. The Green500 ranks the most energy-efficient computer systems, by measuring computational capacity per unit of energy consumed (Gflops/Watts). Source: TOP500 (November 2024), www.top500.org/lists/green500.
Microchip transistor count (Moore's law) refers to the number of transistors to be found on the most advanced, commercially available microchips in a given year. Source: Karl Rupp, https://github.com/karlrupp/microprocessor-trend-data.
Cost of renewable energy captures the global weighted average levelized cost of electricity (LCOE) generation of solar photovoltaics and onshore and offshore wind. Onshore and offshore rates are weighted by their share total installed capacity. Source: International Renewable Energy Agency (IRENA), www.irena.org/Publications/2024/Sep/Renewable-Power-Generation-Costs-in-2023.
Electric battery price refers to the average price of lithium-ion batteries – including cell, module and pack components – measured in real 2024 USD per MWh and weighted by power capacity across all sectors. Source: BloombergNEF (BNEF), https://about.bnef.com/blog/lithium-ion-battery-pack-prices-see-largest-drop-since-2017-falling-to-115-per-kilowatt-hour-bloombergnef.
Cost of genome sequencing refers to the cost of sequencing the DNA of one human genome (in USD). Source: National Human Genome Research Institute (NHGRI), US National Institute of Health, Wetterstrand KA. DNA sequencing costs: data from the NHGRI Genome Sequencing Program (GSP), www.genome.gov/sequencingcostsdata.
Drug approvals refers to the number of novel active substances (NASs). A NAS is a new molecular or biologic entity or combination in which at least one element is new. Includes NASs launched anywhere in the world by year of first global launch. Launch is determined using IQVIA audits of sales activity, as well as companies' public statements. Source: IQVIA Institute for Human Data Science, Global Trends in R&D 2025, www.iqvia.com/insights/the-iqvia-institute/reports-and-publications/reports/global-trends-in-r-and-d-2025.
Safe sanitation refers to that proportion of the population that uses an improved sanitation facility not shared with other households, and where excreta are safely disposed of in situ or removed and treated off-site. Improved sanitation facilities include flush/pour toilets connected to piped sewerage systems; septic tanks or pit latrines; pit latrines with slabs; or composting toilets. Source: WHO/UNICEF Joint Monitoring Programme (JMP) for Water Supply, Sanitation and Hygiene (WASH), https://washdata.org.
Fixed broadband refers to fixed subscriptions for high-speed access to the public internet (a TCP/IP connection) at downstream speeds equal to, or greater than, 256 kbit/s. Penetration refers to the number of subscriptions per 100 inhabitants. Source: International Telecommunication Union (ITU) World Telecommunication/ICT Indicators database, www.itu.int/en/ITU-D/Statistics/Pages/facts.
5G coverage refers to that percentage of the population covered by 5G mobile network technology. Source: International Telecommunication Union (ITU), www.itu.int/en/ITU-D/Statistics/Pages/facts.
Robot adoption is a measure of the number of robots currently deployed in industrial automation applications (also known as the operational stock of industrial robots). The stock is calculated assuming an average service life of 12 years followed by immediate withdrawal from service at the end of that period. Source: International Federation of Robotics (IFR), https://ifr.org/worldrobotics/.
Electric cars stock is the number of passenger cars worldwide that are battery electric vehicles (BEVs) or plug-in hybrid electric vehicles (PHEVs), electric vehicle (EV) share is the percentage of the total passenger cars stock that are electric. Source: International Energy Agency. Global EV Outlook 2024, www.iea.org/data-and-statistics/data-tools/global-ev-data-explorer.
High-speed rail network refers to the total length of high-speed rail lines in commercial operation worldwide. The primary criterion for classification as high-speed rail is a commercial operating speed of 250 km/h or greater. A secondary criterion includes rail lines operating at speeds between 200–230 km/h on medium-distance routes (particularly those without significant air transport competition). Is defined as the ratio of the total length of high-speed rail lines to the global length of railway lines (https://uic.org/support-activities/statistics). For 2023, the global railway lengths were estimated through linear interpolation. Source: International Union of Railways (UIC) – High-Speed Rail Atlas 2024, https://uic.org/IMG/pdf/uic_high-speed_atlas_2024.pdf.
Cancer radiotherapy refers to the total number of linear accelerators per inhabitant. Linear accelerators (LINACs) are devices for delivering high-energy x-rays or electrons to cancers for a therapeutic purpose. A higher ratio indicates a better-equipped health care system. Penetration rate refers to the number of countries that meet minimal radiotherapy resource requirements worldwide, based on a rough assumption that one in every two cancer cases requires radiotherapy and that one machine is needed for every 500 patients requiring radiotherapy. Source: Special tabulations by the International Atomic Energy Agency (IAEA) DIrectory of RAdiotherapy Centres (DIRAC) for the GII based on IAEA DIRAC (https://dirac.iaea.org) and IARC GLOBOCAN (https://gco.iarc.fr) databases.
Labor productivity (rates) refers to the increase in global output per hour worked, expressed in 2024 real USD (PPP), weighted by countries' nominal GDP shares (PPP-converted); (levels) represents global output per employee, also in 2024 real USD (PPP). Source: The Conference Board Total Economy Database™, May 2025, https://conference-board.org/data/economydatabase.
Poverty refers to the number of people living below the international poverty line of USD 3 per day (2021 PPP). Estimates after 2023 are nowcasts. Source: World Bank Poverty and Inequality Platform, https://pip.worldbank.org.
Life expectancy refers to the remaining years of life expected by a hypothetical cohort of individuals alive at age 0 today, who would be subject during the remainder of their lives to the mortality rates of a given year. It is expressed as years. Source: United Nations World Population Prospects 2024, https://population.un.org/wpp/downloads?folder=Standard%20Projections&group=Mortality.
Air temperature anomaly refers to the global mean estimate temperature anomaly with respect to the base period 1951–1980 based on land and ocean data. Source: NASA GISS, https://data.giss.nasa.gov/gistemp.
References
Hernandez, H., F. Hervas and A. Alexander Tuebke (2011). The 2011 EU Industrial R&D Investment Scoreboard, JRC Research Reports JRC67197. Joint Research Centre. Available at: https://iri.jrc.ec.europa.eu/scoreboard/2011-eu-industrial-rd-investment-scoreboard.
International Monetary Fund (IMF), (2025). World Economic Outlook: A Critical Juncture amid Policy Shifts.. Available at: www.imf.org/en/Publications/WEO/Issues/2025/04/22/world-economic-outlook-april-2025.
Nindl, E., L. Napolitano, H. Confraria, F. Rentocchini, P. Fako, J. Gavigan and A. Tuebke (2024). The 2024 EU Industrial R&D Investment Scoreboard. Luxembourg: Publications Office of the European Union. Available at: https://data.europa.eu/doi/10.2760/0775231, JRC140129.
OECD (Organisation for Economic Co-operation and Development) (2025). R&D spending growth slows in OECD, surges in China; government support for energy and defence R&D rises sharply. Paris: OECD Publishing. Available at: www.oecd.org/en/data/insights/statistical-releases/2025/03/rd-spending-growth-slows-in-oecd-surges-in-china-government-support-for-energy-and-defence-rd-rises-sharply.html.