2025 GII Ranking of World’s Top 100 Innovation Clusters
Innovation clusters – whether innovation-driven cities or regions – form the beating heart of national innovation systems. These hubs unite top universities, researchers, inventors, venture capitalists and R&D firms in driving forward breakthrough ideas.
From Bengaluru to Berlin, Boston to São Paulo, Shenzhen or Seoul, global cities blend research, start-ups and R&D firms to power innovation.
Each year, the Global Innovation Index (GII) ranks the top 100 innovation clusters worldwide (Map 1). The GII uses a bottom-up, data-driven methodology that disregards administrative or political borders and instead pinpoints those geographical areas where there is a high density of inventors and scientific authors. The clusters identified in this way often span several municipal districts, sub-federal states, and sometimes even two or more countries.
New methodology incorporates venture capital data
In 2025, three metrics define the top 100 clusters globally (see Appendix IV for details and a comparison to earlier methods, in particular Appendix IV - Table 2 which ranks clusters in accordance with last year’s methodology).
The first metric focuses on the location of inventors listed in published patent applications under the WIPO Patent Cooperation Treaty (PCT).
(1)The WIPO Patent Cooperation Treaty (PCT) assists applicants in seeking patent protection for their inventions internationally, helps patent offices with making patent granting decisions, and facilitates public access to a wealth of technical information relating to these inventions. By filing one international patent application under the PCT System, applicants can simultaneously seek protection for an invention in a large number of countries (www.wipo.int/pct/en). The second metric considers the authors listed on published scientific articles.
These two metrics have served as the foundation for cluster identification across previous GII editions. This year, however, the GII is able to introduce a third metric, namely:
Venture capital (VC) deal locations.
This new approach for 2025 allows the GII to capture entrepreneurial activity and innovation finance, emphasizing start-ups and spin-offs. Together, these three metrics reveal those areas where there is a high concentration of inventors, scientific authors, and/or VC activity.
The innovation ecosystems identified in this way frequently transcend administrative boundaries, encompassing metropolitan areas, multi-regional networks, and cross-border corridors. The resulting top 100 innovation clusters demonstrate a remarkable concentration, collectively accounting for roughly 70 percent of global PCT filings and VC deal activity, and around half of all scientific publications. This concentration becomes even more striking at the highest tier, with the leading 10 clusters alone generating around 40 percent of PCT filings, 35 percent of VC deal activity, and contributing over 15 percent of global scientific publications.
The GII 2025 is also able to identify emerging clusters beyond the top 100 that have an appreciably high level of science, technology and innovation finance. Added to this, the GII also releases a series of Cluster Briefs (available online) that provides further details on the top 100 ranking innovation hotspots.
Shenzhen–Hong Kong–Guangzhou, Tokyo–Yokohama, and San Jose–San Francisco lead the global innovation cluster ranking
Shenzhen–Hong Kong–Guangzhou (China and Hong Kong, China) tops the global rankings, followed by Tokyo–Yokohama (Japan) (see Figure 1). The methodology change has contributed to having a new top-ranked cluster for 2025, reflecting that Shenzhen–Hong Kong–Guangzhou performs more strongly on VC deals compared to Tokyo–Yokohama. However, both clusters continue to make a massive contribution to global scientific publications and patenting outputs, together accounting for nearly one in every five PCT applications filed globally.
San Jose–San Francisco in the United States of America, Beijing in China and Seoul in the Republic of Korea follow in third, fourth, and fifth place, respectively.

In the United States (US), New York City (7th) and Los Angeles (10th), along with London in the United Kingdom (8th), now join the top 10, compared to last year's methodology without VC data included. In turn, Osaka–Kobe–Kyoto (11th, Japan), San Diego (14th, United States) and Nanjing (15th, China) drop out of the top 10. Box 1 examines the top 10 global clusters on each of the three indicators, with Asia leading on scientific publications, Asian and US clusters leading on PCT filings, and US, UK and Asian clusters leading in VC.
The top 10 clusters by patents, publications or VC deals reveal distinct patterns (see Figure 2). Those clusters with the most publications are fully Asian, with the majority in China – with Beijing and Shanghai–Suzhou leading – but with Seoul (Republic of Korea) and Tokyo–Yokohama (Japan) also featuring. PCT applications show a more mixed picture. Three US clusters make the cut, but many Japanese and Chinese clusters feature too. For VC deals, the United States has the most clusters (four) among the top 10, with San Jose–San Francisco and New York City leading. The United Kingdom features among the top 10 for VC deals, with London third – but no other European cluster appears in any top 10 by variable.
Compared to last year, Singapore (16th, Singapore–Malaysia), Tel Aviv–Jerusalem (19th, Israel), Seattle (20th, United States) enter the top 20 in 2025. Two clusters in India enter the global top 30: Bengaluru (21st) and Delhi (26th), along with Philadelphia (23rd, United States) and Berlin (30th, Germany). Newcomers to the top 40 are Toronto (33rd, Canada), two clusters in the United States, Denver (35th) and Austin (37th), and Zürich (Switzerland) is ranked 40th. New to the top 50 are Copenhagen (42nd, Denmark), Mumbai (46th, India) , while São Paulo (Brazil) ranks 49th.
This year, 10 clusters entered the top 100 for the first time: three clusters in the United States, namely, Miami (67th), Phoenix (78th) and Salt Lake City (92nd), two clusters in China, namely, Ningbo (93rd) and Ningde (99th), Dublin (71st, Ireland), Mexico City (79th, Mexico), Oslo (85th, bringing Norway into the top 100), Hamburg (91st, Germany), and Manchester (94th, United Kingdom). The entry of Mexico City (79th) adds a second cluster in Latin America – next to São Paulo (49th) in Brazil – to the top 100.
A combination of performance shifts and the implementation of this year's new methodology has resulted in the exclusion of 10 clusters from the top 100: Nuremberg–Erlangen (Germany), Lanzhou (China), Fuzhou (China), Ankara (Türkiye), Cincinnati (United States), Daegu (Republic of Korea), Nanchang (China), Basel (Switzerland–Germany–France), Brisbane (Australia) and Kunming (China).
Clusters by economy
The top innovation clusters for each country or cross-border region are shown in Table 1. The leading clusters per country remain unchanged from last year, except for Barcelona overtaking Madrid to become the leading Spanish cluster. Additionally, the top 100 ranking now includes new entrants from previously unrepresented countries: Dublin emerges as the foremost innovation cluster for Ireland, Mexico City for Mexico, and Oslo for Norway.

China and the United States lead on number of top innovation clusters
China, for the third consecutive year, leads with the most clusters (24, two fewer than last year) in the top 100 (see Figure 3 and Maps 2 a-e). The United States follows closely behind with 22 clusters (+2 compared to last year). The introduction of VC deal counts as a variable in this year's methodology has thus narrowed the gap between China and the United States.
Germany continues to rank third with seven clusters (one fewer than last year) in the top 100, with Munich (27th), Berlin (30th) and Cologne (43rd) in the lead. The United Kingdom now has four clusters among the top 100 (up from three last year, without VC), with London (8th), Cambridge (69th), Oxford (77th) and new entrant Manchester (94th). France has two clusters in the top 100 (down from three), with Paris still first at rank 12, followed by Lyon (90th), but Basel – a cross-border cluster previously shared with Germany, France and Switzerland – drops out of the top 100 ranking.
India still has four clusters in the top 100: Bengaluru (21st), Delhi (26th), Mumbai (46th) and Chennai (84th), with most clusters boosted significantly by the inclusion of VC deal counts. Japan maintains three clusters among the top 100: Tokyo–Yokohama (2nd), Osaka–Kobe–Kyoto (11th) and Nagoya (28th), whereas the number drops from four to three for the Republic of Korea–Seoul (5th), Daejeon (25th) and Busan (95th), with Daegu dropping out from the top 100.
Canada still has three clusters, with Toronto (33rd) retaining its position as the country’s leading innovation cluster, followed by Montreal (62nd) and Vancouver (66th). Australia now has two clusters in the top 100, down from three in 2024, with Sydney (36th) and Melbourne (52nd).
In addition to China and India – with Mexico entering in 2025 – six other middle-income economies have clusters among the top 100. They are as follows:
Brazil (1 cluster), with São Paulo (49th)
Egypt (1), with Cairo (83rd), the sole top 100 innovation cluster within Africa
Islamic Republic of Iran (1), with Tehran (63rd)
Malaysia (2), with Kuala Lumpur (86th), and its cluster shared with Singapore (16th)
Mexico (1) enters the top 100 with Mexico City (79th), now the second cluster within Latin America
Türkiye (1), with Istanbul in at 58th.
Note that the Russian Federation, with one cluster in 2025 (Moscow, ranking 48th), no longer features here as it now classifies as a high-income economy.
Regarding those African innovation clusters not yet covered by the top 100 a separate analysis was conducted last year (see “GII 2024: Sustaining the rise of top-notch African innovation clusters”, GII Innovation Insights, November 20, 2024 www.wipo.int/en/web/global-innovation-index/w/blogs/2024/gii-2024-african-innovation-clusters).
Regional distribution
In general, when comparing the latest results of the top 100 clusters between the new and old methodologies, there is a slight downward trend observable in the rankings with respect to Asian clusters, whereas many clusters in the United States have made gains (see Appendix IV - Table 2). On average – and with notable exceptions such as Shenzhen–Hong Kong–Guangzhou, which now ranks first globally – Chinese clusters have declined in rank. A similar pattern is observed for clusters in Japan and the Republic of Korea, in part a reflection of the lesser but growing role played by VC, but also of the type and structure of innovation finance within these two economies – large industry conglomerates favoring in-house innovation.
However, within Asia the same is not true for Indian clusters. Three out of four Indian clusters rise sharply in the ranking when accounting for VC deals. Bengaluru moves to 21st (compared to 52nd when using the old methodology), Delhi to 26th (compared to 63rd) and Mumbai to 46th (compared to 88th); the exception is Chennai, now ranked 84th (compared to 77th when using the old methodology). Beyond the top 100, Indian clusters likewise gain: Hyderabad is 102ndand Pune 112th, both clusters now knocking at the door of the top 100, while Kolkata ranks 158th.
Clusters in the European Union – where VC markets are sometimes less vigorous than in the United States and other financial centers such as London or Singapore – also tend to have seen a decline in ranking compared to last year when VC capital activity was excluded.
Beyond the top 100
Bangkok, Ankara, Rio De Janeiro and Buenos Aires are among top middle-income economy innovation clusters
The GII 2025 also presents innovation clusters beyond the top 100 in order to highlight additional areas around the world with an appreciably high level of science, technology and innovation finance.
Based on the same parameters applied in producing the top 100 innovation clusters ranking, and therefore including VC counts, an additional 137 clusters were identified beyond the top 100, with the following three close to entering: Riyadh (101st, Kingdom of Saudi Arabia), Hyderabad (102nd, India) and Lausanne (103rd, Switzerland).
Table 2 identifies the top innovation clusters in economies not previously represented in the top 100, including Pakistan, Portugal and Saudi Arabia. Moreover, Pakistan is effectively adding one cluster with Lahore joining Islamabad.
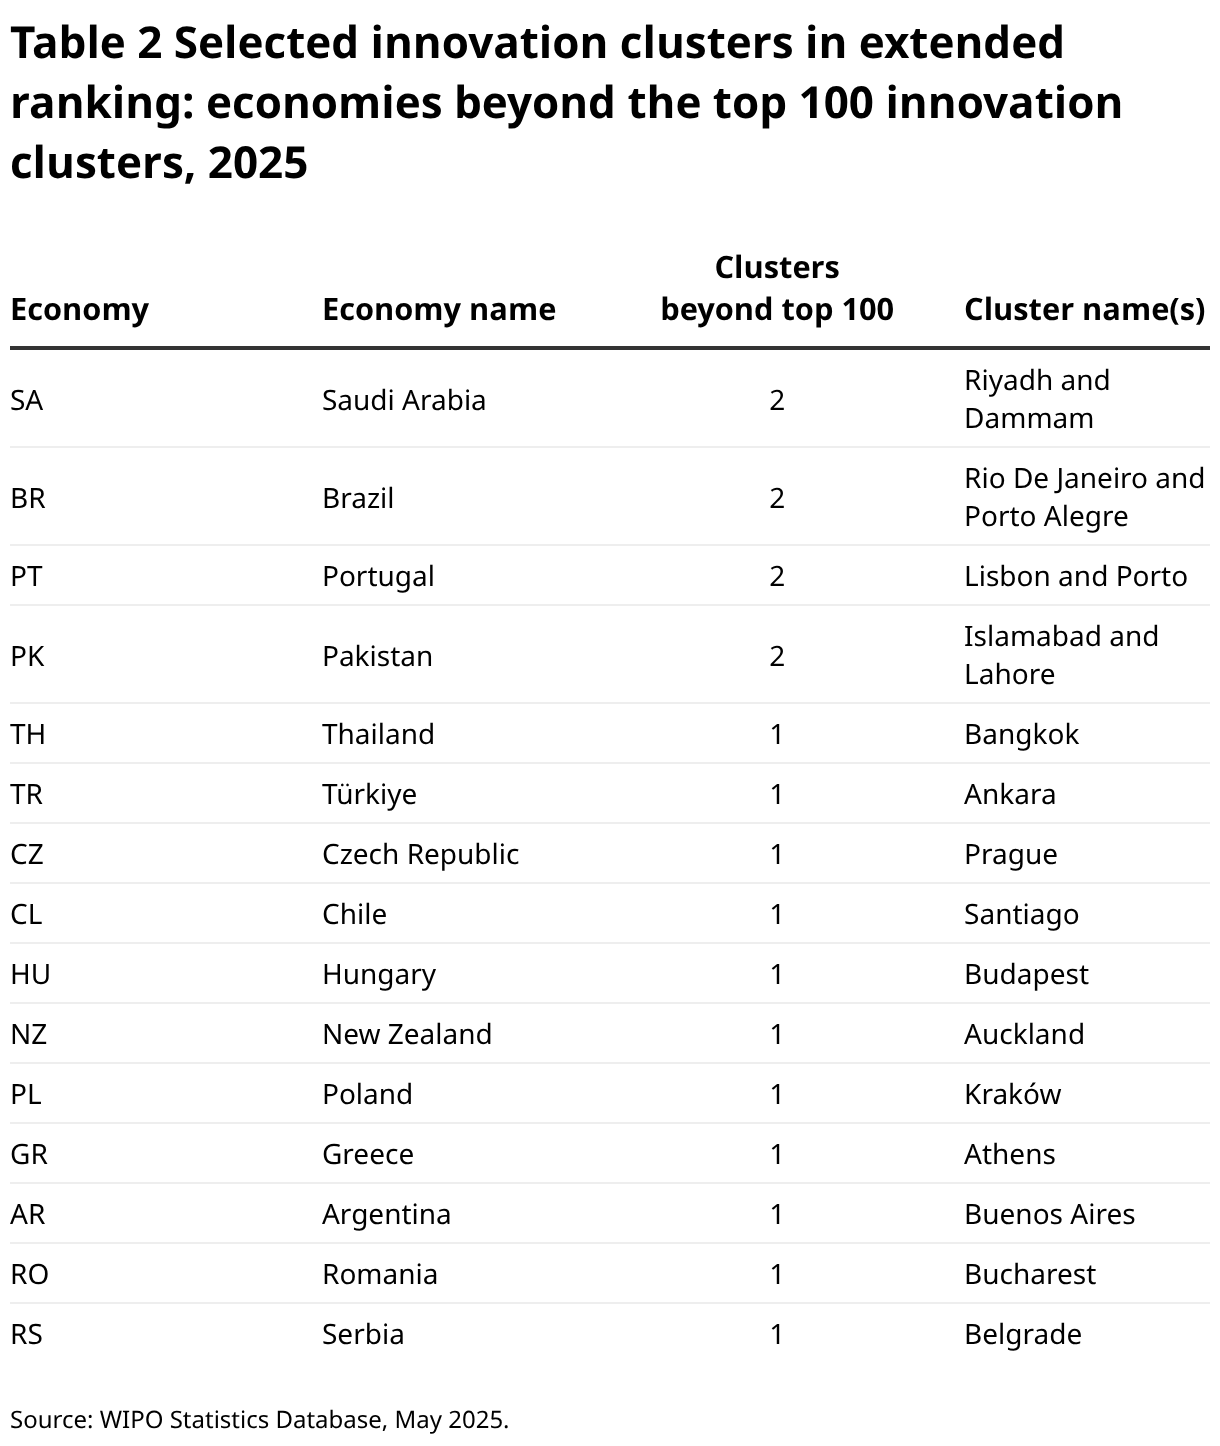
Middle-income economies, Argentina, Serbia and Thailand each host a top innovation cluster in the extended list, namely, Buenos Aires, Belgrade and Bangkok, respectively.
GII 2025 adds seven new clusters to the list of innovation clusters beyond the top 100, compared to last year when VC was excluded:
Canada (1 cluster): Québec City (228th)
China (2): Ürümqi (218th) and Guilin (229th)
Finland (1): Oulu (218th)
Republic of Korea (1): Ulsan (209th)
Pakistan (1): Lahore (191st)
Slovenia (1): Ljubljana (225th).
Top innovation intensity clusters per capita
The most innovation-intensive clusters: Cambridge and San Jose–San Francisco lead; Ningde (China) ranks fifth in the world thanks to one company
Since 2020, the Global Innovation Index (GII) has also ranked the top 100 clusters by innovation intensity – measured as the combined global share of patents, scientific publications, and (now including) VC deals, normalized by population (see Appendix IV for methodology).
In the latest ranking, San Jose–San Francisco (United States), Cambridge (United Kingdom), Boston–Cambridge (United States), Ningde (China), and Oxford (United Kingdom) emerge as the world’s foremost innovation-intensive clusters (Appendix IV - Table 2). The United States leads with five of the top 10 clusters, followed by the United Kingdom with two, and one each in China (Ningde), Finland (Helsinki) and the Kingdom of the Netherlands (Eindhoven).
Ningde’s entry into the global top 5 is a standout development, driven primarily by a surge in patent activity from Contemporary Amperex Technology Co., Limited (CATL) – a global leader in energy technologies and battery innovation (Table 3).
Leading clusters typically host world-class research institutions such as Stanford, Cambridge and Harvard. Top innovation players include tech giants like Google, ARM, and Qualcomm, alongside leading universities such as the Massachusetts Institute of Technology (MIT) and the University of Michigan.

Different paths to innovation intensity among top clusters
While all top 25 clusters rank highly in terms of overall innovation intensity, they have different strengths. Ningde (China), San Jose–San Francisco (United States) and Eindhoven (Kingdom of the Netherlands) lead in PCT patent applications per capita (see Figure 4). Cambridge (United Kingdom), Oxford (United Kingdom), and Ann Arbor (United States) – classic university towns – rank highest in scientific publications per capita, whereas San Jose–San Francisco (United States) Cambridge (United Kingdom) and Austin (United States) top the list for VC deals per capita.
Many clusters within the top 25 show a balanced performance across all three indicators. Others exhibit a distinct skew, for example:
Ningde (China) leads in PCT applications per capita (over 13,000), yet has minimal scientific output and VC activity. Similar patters are also evident in Nagoya (Japan), Eindhoven (Kingdom of the Netherlands), Tokyo-Yokohama (Japan), Osaka–Kobe–Kyoto (Japan) and Stuttgart (Germany)
Austin (United States), London (United Kingdom) and New York City (United States) all excel in VC deal activity, but are low in global publications;
conversely, Chinese clusters Xi'an, Changsha, Changchun, Harbin, Chengdu and Jinan have solid publication activity, but are relatively low in patent and VC deal activity.
These variations reflect a diversity of innovation models – ranging from science-driven ecosystems to VC-heavy start-up hubs and underscoring the different paths to innovation.
Only two clusters rank among the global top 10 innovation clusters as well as the top 10 by intensity: San Jose–San Francisco and Boston–Cambridge, both located in the United States.
Expanding to the top 25, there are nine clusters that appear in both the global top 25 and the top 25 by intensity. In addition to San Jose–San Francisco and Boston–Cambridge, they include Seattle (United States), San Diego (United States), New York City (United States), London (United Kingdom), Beijing (China), Hangzhou (China) and Daejeon (Republic of Korea).
This overlap highlights the continued dominance of the United States in terms of both cluster size and intensity, while at the same time underscoring the global presence of select high-performing clusters in Asia and Europe.
Helsinki and Eindhoven lead the EU in innovation cluster intensity
In the 2025 WIPO GII Global Innovation Cluster Intensity Ranking, Helsinki (9th, Finland) and Eindhoven (10th, Kingdom of the Netherlands) emerge as the highest-ranking clusters within the European Union (EU) (Appendix IV - Table 3). They are followed by EU clusters Stockholm (11th, Sweden), Copenhagen (12th, Denmark), Munich (16th, Germany), Göteborg (20th, Sweden) and Dublin (23rd, Ireland).
When focusing on innovation intensity – which accounts for patent filings, scientific publications and VC deals relative to population – North American clusters tend to outperform their Asian and EU counterparts, especially in respect to higher VC activity.However, the United Kingdom stands out as a strong performer in Europe, with Cambridge (2nd), Oxford (5th), and London (19th) consistently ranking among the most intense innovation hubs globally.
This contrast underscores regional differences in innovation ecosystems, with Northern America excelling in commercialization and investment, and European clusters leaning on strong research and technological foundations.
References
Bergquist, K. and C. Fink (2020). The top 100 science and technology clusters. In Dutta, S., B. Lanvin and S. Wunsch-Vincent (eds), The Global Innovation Index 2020: Who Will Finance Innovation? Ithaca, NY, Fontainebleau and Geneva: Cornell University, INSEAD and World Intellectual Property Organization (WIPO).
de Rassenfosse, G. and S. Wunsch-Vincent (2024). Enabling Innovation Measurement at the Sub-National Level: A WIPO toolkit. Lausanne and Geneva: École polytechnique fédérale de Lausanne and WIPO. Available at: www.wipo.int/edocs/pubdocs/en/wipo-pub-rn2023-27-en-enabling-innovation-measurement-at-the-sub-national-level.pdf.
WIPO (2025). Use of WIPO’s global IP registries for patents, trademarks and designs grew in 2024. Geneva, March 17, 2025 PR/2025/934. Available at: www.wipo.int/pressroom/en/articles/2025/article_0003.html.
CATL has become the 5th biggest global PCT filer in 2024, after Huawei, Samsung, Qualcomm and LG Electronics, see (Annex 2): www.wipo.int/export/sites/www/pressroom/en/documents/pr-services2025-annexes.pdf#page=2.