
A rebound in trademark filing gains momentum, with applications increasing by 4% in 2025 after a slow 2024 recovery
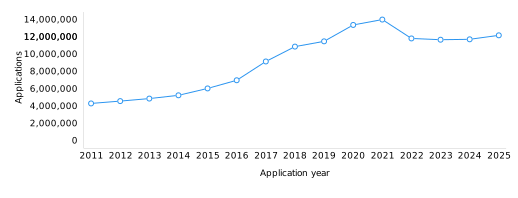
Building on the modest gains of 2024, global trademark applications rose by 4% in 2025, reaching an estimated 12.2 million filings worldwide – 462,000 more than the previous year. This represents the second consecutive year of growth, following two years of contraction in 2022 and 2023 (figure 2.1).
The current recovery stands in stark contrast to the surge witnessed during the early stages of the COVID-19 pandemic. In 2020, trademark applications jumped 16.6% as businesses moved quickly to protect new goods and services amid rapidly shifting market conditions. The declines of 2022 and 2023 broke a remarkable 12-year run of expansion that had begun as the global economy recovered from the 2009 financial crisis. Even so, the long-term outlook remains positive: trademark applications in 2025 were nearly three times the level recorded in 2011 – a growth propelled in large part by double-digit annual increases in six of the past 15 years.
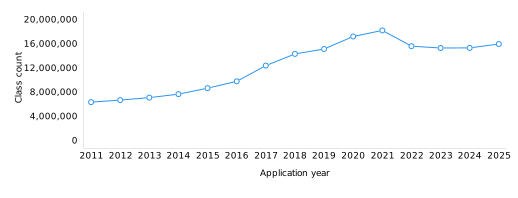
When differences between filing systems across national and regional offices are harmonized based on application class count, 2025 showed a 4.1% on-year increase – closely mirroring the 4% growth in trademark applications. The total number of classes specified in applications – known as the application class count – increased by a class count of 632,800 from about 15.3 million in 2024 to an estimated 15.9 million in 2025 (figure 2.2). The global application class count had experienced a steep decline of 14.4% in 2022, followed by a smaller 1.9% decrease in 2023. These two consecutive years of decline are the only period when the global application class count has fallen over the past 15 years.
Growth in 2025 was considerable among several top countries of origin spanning different continents. Applicants based in India alone accounted for 17% of the overall increase, adding an application class count of 107,296. The United States of America (US) and China followed, each accounting for about 10% of the increase (+62,108 and +60,741, respectively), ahead of the United Kingdom (UK) (+49,355), Argentina (+46,111) and Germany (+44,722). Together, these six origins accounted for over half (59%) of the net global increase.
Of the estimated 15.9 million classes specified in trademark applications filed worldwide in 2025, resident filing accounted for 13.3 million (83.6% of the total), while non-resident filing made up the remaining 2.6 million (16.4%) (figure B3). This underscores that the vast majority of trademark protection – over four-fifths of the total – was sought domestically within an applicant’s home jurisdiction. Notably, China alone accounted for over half (50.9%) of all global resident trademark filing – far ahead of India (4.7%) and the US (4.1%), the second- and third-largest sources. Resident filing grew by 3.8% in 2025, though non-resident filing expanded at a notably faster rate of 6%. In terms of volume, the resident filing total of 13.3 million in 2025 is roughly three times the 2011 level of 4.6 million, largely driven by a five-fold increase in resident trademark filing in China over this period. Non-resident filing, by contrast, rose from about 1.7 million in 2011 to 2.6 million in 2025, approximately 1.5 times the 2011 level.
A trademark application can refer to different classes of goods or services. Many offices use the Nice Classification. This is an international classification of goods and services used for registering trademarks and service marks. Applications received at these offices are classified according to one or more of 45 Nice classes (see www.wipo.int/classifications/nice). Some offices allow only single-class filing, meaning applicants have to file a separate application for each class; others permit multi-class filing, enabling applicants to file a single application wherein a number of classes are specified. To improve the international comparison of numbers of applications received, it helps to compare class counts across offices. Class counts are also used to make trademark registration internationally comparable. This method for comparing offices began in 2004, the first year for which complete class count data are available.
From over a half to nearly two-thirds: Asia’s rising share of global trademark filing
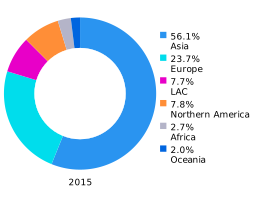
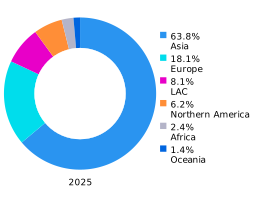
In 2025, the majority of trademark filing took place within Asia, which accounted for 63.8% of the world total – up from 56.1% a decade earlier in 2015. This growth has correspondingly reduced the relative shares of four of the other five geographical regions (figure 2.3). In 2025, Europe held the second-largest share at 18.1%, followed by Latin America and the Caribbean (LAC) at 8.1% – a slight increase from 7.7% in 2015. Northern America ranked fourth at 6.2%, while the remaining regions accounted for smaller portions: Africa at 2.4% and Oceania at 1.4% of global filing.
 Note: LAC is Latin America and the Caribbean.
Trademark filing grew by more than 20% in 2025 for three of the top 20 origins: Argentina (+51.8%), India (+20.1%) and Indonesia (+23.1%)
Measured by absolute application class count, the largest volume of filing came from applicants based in China, whose combined resident and abroad count of almost 7.4 million far exceeded all other origins. The US ranked a distant second at 900,720, followed by India (640,708), the Russian Federation (501,581) and Germany (478,619) (figure 2.4). Growth among these top five origins was mixed. India led this group with a substantial 20.1% increase, driven mainly by a 21% rise in resident filing alongside a more modest 1% gain in filing abroad. Germany followed at 10.3%, with the US up 7.4% and China posting a slight 0.8% increase. The Russian Federation, by contrast, was the only top-five origin to contract, with filing down 10.4% overall – resident filing fell by 10%, while filing abroad dropped more sharply, by 19%.
As with India, growth in trademark filing by applicants based in Germany and the US was driven primarily by double-digit increases in their respective domestic filing. In contrast, China-based applicants’ flat growth of 0.8% resulted from a 14.9% rise in abroad filing that more than offset a slight 0.3% decline in resident filing.
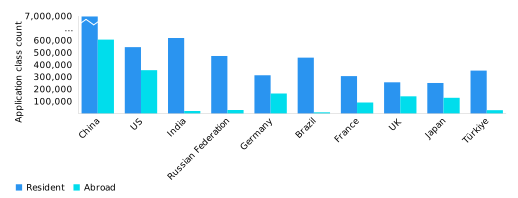
Origin data track applications according to country of origin – that is, where the applicant resides. This perspective combines an applicant’s filing at their home or regional office (resident applications) with the filings they made at foreign offices (applications abroad), and so helps give a complete picture of trademark filing worldwide. Origin data can be compiled in one of two ways: by absolute count, where an application filed at a regional office is counted only once; or by equivalent count, where the same application is counted multiple times. The data reported in this section are based on absolute count.
Office data, by contrast, track applications according to the office where the filing has taken place. This includes all applications received by an office, whether from residents or non-residents, and shows where trademark protection is being sought. Office data are presented in later sections of this report.
In 2025, 16 of the top 20 origins posted an increase in filing. Alongside third-ranked India’s considerable 20.1% growth, two other origins recorded particularly large gains: Argentina (+51.8%) and Indonesia (+23.1%). Indonesia’s growth was driven by double-digit increases in both resident and abroad filing. Argentina’s, however, stemmed entirely from resident filing, with filing abroad declining. Germany was joined by Japan, Spain and the UK in achieving double-digit growth of about between 10% and 14% (figure B5). In contrast, trademark filing fell for four of the top origins. In addition to the Russian Federation (–10.4%), the Islamic Republic of Iran saw the steepest decline at 31.3%, followed by Türkiye (–5.2%) and Switzerland (–3.8%).
Distinct patterns are evident in resident versus abroad filing preferences. China-based applicants showed a strong domestic focus in 2025, directing 91.8% of trademark filing within China and the remaining 8.2% toward protection abroad. This orientation has held steady over the past two and a half decades, with China-based applicants consistently focusing 90% or more of filing on the home market each year. A similar pattern emerged among other origins with substantial filing volumes. Residents of Argentina, Brazil, India, Indonesia, the Islamic Republic of Iran, Mexico, the Russian Federation, Türkiye and Viet Nam each directed about 9% or less of their total 2025 filing abroad. Within this group, applicants resident in the Islamic Republic of Iran displayed the strongest domestic preference, directing just 1% of filing abroad. Other notably low abroad filing shares were recorded by Argentina (3.6%), Brazil (2.2%), India (3.3%) and Indonesia (2.9%).
In contrast, among the top 20 origins, Swiss applicants showed the strongest international focus, directing 69.5% of trademark filing toward foreign jurisdictions. Other origins with a high share of abroad filing included Germany (34.4%), Japan (34%), the UK (35.6%) and the US (39.5%).
Trademark filing abroad varied considerably among applicants from selected low- and middle-income countries (figure B6). A group of these countries showed moderate international filing activity, with abroad filing representing between about 12% and 19% of total filing. This group included Colombia (16.1%), El Salvador (14.7%), Jamaica (19%), South Africa (11.6%), Thailand (17.6%) and Ukraine (12.8%). In contrast, applicants from five of the selected countries directed a substantial proportion of filing abroad: Belarus (41.2%), Iraq (37.9%), Malaysia (25.3%), Samoa (94.9%) and Serbia (51.3%). Finally, applicants from nine countries – Angola, Bangladesh, Egypt, Ethiopia, Kazakhstan, Nigeria, Pakistan, Paraguay and Peru – maintained a predominantly domestic focus, with abroad filing accounting for around 8% or less of total trademark filing.
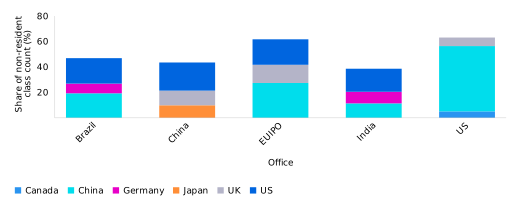
Applicants weigh multiple factors when selecting foreign jurisdictions for trademark protection. They include the market appeal for their goods and services, geographical proximity and historical ties between the home country and the destination market. Such strategic considerations are reflected in the filing patterns of applicants from abroad at major offices in 2025. China received 43.5% of its foreign trademark filing from just three key origins: the US led with 21.1%, followed by the UK (11.5%) and Japan (9.9%) (figure 2.5). In the US, China-based applicants dominated foreign filing activity, accounting for over half (51.3%) of all non-resident filing. UK applicants accounted for a further 6.7% of the total and Canadian applicants 5.1%, bringing the combined share for these three origins to 63.1% of total foreign filing in the US. India’s foreign application landscape was more balanced, with the top three sources – the US (18.1%), China (11.4%) and Germany (9.1%) – collectively accounting for 38.6% of non-resident filing in India. Like the US, the European Union Intellectual Property Office (EUIPO) recorded a high concentration of foreign filing from its leading origins, with 61.7% originating again from just three countries: China (27.4%), the US (20%) and the UK (14.3%). In Brazil, the top three sources accounted for 46.9% of all foreign filing, with the US (20%) and China (19.3%) holding almost equal shares, followed by Germany (7.6%).
 Note: EUIPO is the European Union Intellectual Property Office.
Expanding to include the top 15 offices, China-based applicants stood out as the leading origin of foreign trademark filing in 2025, ranking first in non-resident filing at 10 of the other 14 top offices (figure B10). Their non-resident share was pronounced at several key offices, where they accounted for 60.9% of foreign filing in Germany, 30.4% in the Islamic Republic of Iran, 32.7% in Japan, 30.6% in the Russian Federation, and, as noted earlier, 51.3% in the US. US-based applicants led foreign filing at four of the remaining top offices, with their non-resident share ranging from the previously mentioned 18.1% in India to 31.2% in Mexico. Germany-based applicants, meanwhile, were the largest source of non-resident filing in Türkiye, accounting for 14.3%.
Adjusting for GDP and population
Cross-country variations in trademark filing largely reflect differences in economic size and structure. To account for these differences, it is useful to examine resident trademark application class counts relative to both gross domestic product (GDP) and population.
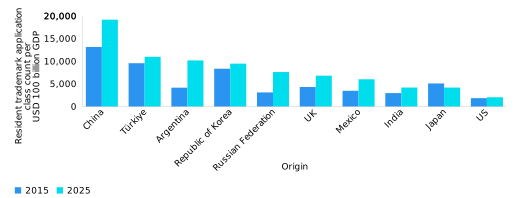
When resident application class counts are adjusted for GDP, countries with relatively lower class counts – such as Argentina and the Republic of Korea – can rank higher than countries with larger counts, such as India and the US. Among selected origins, China (19,196) recorded one of the highest ratios of resident class count to GDP in 2025, followed by Türkiye (10,998), Argentina (10,205), the Republic of Korea (9,492) and the Russian Federation (7,638) (figure 2.6). This GDP-adjusted perspective highlights the intensity of trademark filing relative to economic output. Between 2015 and 2025, several countries saw a substantial increase in resident application class count per unit of GDP: China posted the largest, at 6,029 additional classes, followed by Argentina (+6,016) and the Russian Federation (+4,498).
Resident application class count per million population offers another perspective on filing intensity across countries. In 2025, Switzerland – with a population of about 9.1 million – recorded a particularly high ratio of 5,055 classes per million population, the highest among all selected origins (figure B12). China, home to 1.4 billion people, also posted a relatively high ratio of 4,812, followed by France – with a population of 68.7 million – at 4,472, while New Zealand reached 4,408 despite having a far smaller population of around 5.3 million. These four countries were among a broader high-intensity group that also included Türkiye (4,102), Germany (3,762), the UK (3,689), Australia (3,513) and the Russian Federation (3,291). A moderate group comprised Chile (2,651), Brazil (2,155), Japan (2,034), Mauritius (1,787), the US (1,594), Mexico (1,323) and Peru (1,122). At the lower end, India, Pakistan, South Africa and Viet Nam recorded the lowest ratios, ranging from about 250 to 860 classes per million population.
Offices handling the largest trademark filing volumes
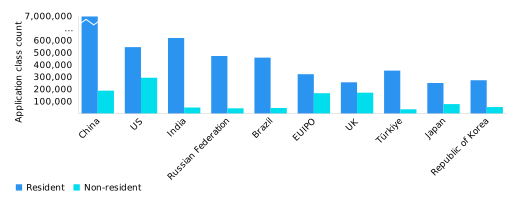
This section presents trademark statistics from the office perspective, organizing data by domestic (resident) and foreign (non-resident) filing at IP offices, complementing the picture of trademark filing by origin presented earlier. The office of China remained the world’s most active office for trademark filing in 2025, despite a 0.3% decline on the previous year. Its application class count of almost 7 million far exceeded that of the US, which recorded 838,681 (figure 2.7). These two offices have held the top two positions since the early 2000s, though the gap between them has widened considerably over time. China’s remarkable growth becomes clear when comparing relative volumes: what stood at about three times the US level in 2011 had expanded to more than eight times a decade and a half later, in 2025. This surge stems primarily from the high volume of domestic applications filed by China-based residents. India (669,349), the Russian Federation (515,295) and Brazil (504,538) round out the top five filing offices. Together, these five offices accounted for 59.6% of all global trademark filing based on application class count in 2025 – a marked increase from 41.5% in 2011, when the top five offices comprised the EUIPO, China, France, the Russian Federation and the US.
 Note: EUIPO is the European Union Intellectual Property Office.
Of the top 20 offices, 16 recorded increases in trademark filing in 2025 relative to 2024 (figure B15). The strongest growth occurred at the offices of Argentina (+50.8%), India (+20.5%), Indonesia (+20%), Germany (+19.9%) and the UK (+18.9%). Growth patterns were broadly similar across these 16 offices, 15 of which saw a growth in both resident and non-resident filing. In Germany, for example, resident filing contributed 11.4 percentage points of that office’s 19.9% total growth, with non-resident filing accounting for the remaining 8.5 percentage points. The US was the sole exception, being the only office where resident filing rose, while non-resident filing declined.
Resident filing drove the bulk of overall growth at nearly every one of these offices, and accounted for the entirety at the office of the US. Viet Nam was the exception: there, an increase in non-resident filing contributed 3.2 percentage points of the office’s 4.1% total growth, while resident filing added just 0.9 percentage points.
The remaining four top offices recorded an on-year decline. The Islamic Republic of Iran saw the steepest fall at 30.7%, followed by the Russian Federation (–9.2%), Türkiye (–2.9%) and China (–0.3%). These declines all stemmed primarily from a weaker domestic demand, as residents filed fewer applications. In the Islamic Republic of Iran and the Russian Federation, non-resident filing also declined. Türkiye, by contrast, saw a slight rise in non-resident filing despite a fall in resident filing, whereas in China the overall decline was driven entirely by resident filing, as non-resident filing held essentially steady between 2024 and 2025.
Among the top 20 offices, six received more than a third of applications from non-residents – well above the global non-resident share of 16.4% in 2025. The EUIPO (34.1%) and the offices of Australia (42.5%), Canada (61%), the UK (40.1%), the US (35%) and Viet Nam (33.7%) stood out by having the largest shares in this regard (figure B14). At the opposite end of the spectrum, eight top offices recorded non-resident shares below 10%: Brazil (9.1%), China (2.7%), France (5.2%), India (7.4%), the Islamic Republic of Iran (3.2%), Italy (7.9%), the Russian Federation (8.3%) and Türkiye (9%). The low non-resident shares at the offices of France and Italy reflect the fact that many international applicants seek trademark protection within EU countries through the EUIPO, rather than through individual EU national offices.
The composition of the top 20 offices for trademark filing remained unchanged in 2025, though three offices saw a notable shift in rank. Due primarily to double-digit growth in resident filing, India rose from 4th in 2024 to 3rd in 2025, overtaking the Russian Federation, which declined on both counts. Argentina climbed three places, from 20th to 17th – surpassing Italy and Viet Nam following a surge in domestic filing. The Islamic Republic of Iran, by contrast, fell three positions, from 11th to 14th, largely owing to a steep decline in resident filing. Geographically, the top 20 offices were spread across multiple regions in 2025: eight in Asia, six in Europe, three in the LAC region, two in Northern America and one in Oceania.
The top 20 offices in 2025 spanned a range of income levels: 11 were located in high-income economies, eight in upper middle-income countries (Argentina, Brazil, China, Indonesia, the Islamic Republic of Iran, Mexico, Türkiye and Viet Nam) and one – India – in a lower middle-income country. Beyond the top 20, several offices in low- and middle-income economies also recorded substantial filing measured by application class count (figure B16), among them Egypt (82,229), Thailand (78,860), Pakistan (72,390), the Philippines (71,805) and Malaysia (60,207). Among 20 selected offices in low- and middle-income economies, several achieved notable annual growth of 15% or more: Nigeria led with 34.6%, followed by Pakistan (+22.6%), Kazakhstan (+17.8%) and Peru (+15.6%), while the African Intellectual Property Organization (OAPI) and South Africa each recorded 15% growth. In contrast, four of the selected offices recorded a decline, with Egypt (–14.1%) and Belarus (–5.7%) recording the largest falls (figure B17).
Measured by simple trademark applications, rather than application class count, the number of trademark applications followed a relatively steady, but modest trajectory until the mid-1980s. The landscape began to shift dramatically during the 1990s, when China experienced a surge in applications that continued until 2021, before beginning to decline. China overtook the US as the world’s largest IP office in 2001, a position it has held ever since. Despite being surpassed, the US office has continued to record impressive growth: applications filed there have risen nearly 3-fold since 2001, weathering notable declines during the dot-com collapse (2001–2002), following the global financial crisis (2008–2009), and during the recent downturn of 2022–2023. Other major offices have also expanded significantly. India, which had recorded fewer than 100,000 annual applications until 2006, reached nearly 651,000 in 2025 and moved into second place. Brazil ranked as the fourth-largest office, with almost 489,000 applications, while the Russian Federation rounded out the top five at around 155,500 applications in 2025.
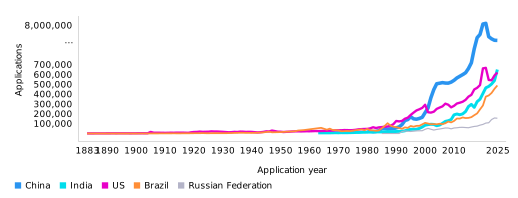
Classes and industries attracting the most intensive filing
Trademarks are registered in relation to particular classes of goods or services. The Nice Classification of goods and services is used in the international trademark system and at certain national and regional offices. Nice classification statistics provide insights into the relative importance of different goods and services. In 2025, goods class 9 – including scientific, photographic and measuring instruments, recording equipment, computers and software – featured in 11% of all reported non-resident trademark filing by class (figure B18). It was followed by services class 35 (7.1%), which covers advertising, business management, business administration and office functions; services class 42 (5.9%); and goods classes 5 (5.7%) and 3 (5.3%). Services class 42 includes scientific and technological services, as well as the design and development of computer hardware and software. Goods class 5 relates to pharmaceutical preparations, baby food, dietary supplements for humans and animals, disinfectants, fungicides and herbicides, while goods class 3 covers cleaning preparations, soaps, perfumes and cosmetics, among other items. Of the total 45 Nice classes, the top five (9, 35, 42, 5 and 3) were specified in more than a third (35%) of all reported non-resident trademark filing worldwide.
Service-related classes accounted for 28.2% of all Nice classes specified in applications filed abroad in 2025, despite making up only 11 of the 45 Nice classes (figure B19). Turning to total filing – encompassing both resident and non-resident applications – the share of services classes varied considerably across offices. The lowest service shares appeared at the offices of China, India, Indonesia and Viet Nam, where services classes represented from about 31% to 34% of total filing. A middle tier – comprising the EUIPO and the offices of Australia, Canada, Germany, Japan, the Republic of Korea, the Russian Federation and the UK – saw services classes account for approximately 38% to 44% of trademark filing. At several offices, services classes dominated, exceeding half of total filing in five: Brazil led with 64.2%, followed by France (52.9%), Türkiye (52.4%), Argentina (51.2%) and Mexico (50.8%) (figure B24).
Grouping the 45 Nice classes into 10 distinct industry sectors offers further insights. In 2025, the research and technology sector attracted the largest volume of filing from applicants seeking trademark protection abroad, accounting for 19.1% of global reported non-resident trademark filing (figure B20). It was followed by the health (14.6%), clothing and accessories (11.9%) and leisure and education (10.6%) sectors. Trademarks relating to agriculture (9.7%), household equipment (9.5%) and business services (9.1%) made up the next largest shares. At the other end, the transportation (6.9%), construction (5.5%) and chemicals (3%) sectors received the smallest proportions of filing abroad.
Research and technology attracted the largest share of total filing at the EUIPO (21.9%) and at the offices of the US (21.3%), the UK (20.8%) and Japan (19.3%) (figure B23). It ranked third at the offices of Brazil (13.8%), the Russian Federation (12.7%) and Türkiye (11.9%). The agricultural sector was the predominant choice in China (26.5%) and the second-largest in India (16.2%), the Republic of Korea (16.6%) and Türkiye (15.5%). Business services topped the list of industry sectors in Brazil (25.2%), Türkiye (25%) and the Republic of Korea (18.4%), and ranked second in China and the Russian Federation (13.3% each) and at the EUIPO (12.7%). Clothing and accessories drew the largest share of total filing in the Russian Federation (13.6%), but did not feature among the top three sectors at any of the other nine top offices. Health-related filing accounted for the largest proportion in India (22.1%) and the third-largest in China (13.1%), the Republic of Korea (15.9%) and the US (12.4%). Finally, leisure and education featured as the second top sector at the offices of Brazil, Japan, the UK and the US, and the third at the EUIPO.
Global trademark registrations fell to approximately 7.8 million in 2025
After concluding its examination process, an office may decide to register a trademark. Registration numbers can fluctuate considerably from year to year, reflecting not only changes in the volume of trademark applications received, but also the resources an office is able to dedicate to examination. For this reason, the number of applications filed at a particular office in a given year cannot be directly compared with the number of registrations issued by that office in the same year.
Global trademark registrations fell to an estimated 7.8 million in 2025, an on-year decline of 6.5% following growth of 9.3% in 2024, when they numbered about 8.4 million (figure B27). This decrease is equivalent to 547,200 fewer registrations than the previous year.
Just as class counts make application filing activity internationally comparable, they also enable a more meaningful comparison of registrations. In 2025, an estimated 10.7 million classes were specified in the 7.8 million trademark registrations noted above, reflecting a 3.5% decrease from the previous year’s total (figure B28) – a somewhat more muted decline than the 6.5% drop in registrations themselves. While 15 of the 20 top offices recorded an increase in registrations in 2025, two of the remaining five posted a double-digit decrease. Registrations at the office of India, measured by class count, fell by 68.3% – about 335,400 fewer than in 2024 – following exceptional growth of 94.5% the year before. The office of China recorded an 11.9% decline in registration class count, equivalent to about 570,800 fewer registrations than the previous year. Together, these two offices accounted for most of the global decrease in trademark registration.
China’s office registered trademarks in which about 4.2 million classes were specified, accounting for a sizable 39.7% of all registration class counts recorded worldwide in 2025. It was followed by the office of the US (570,062), the EUIPO (418,149), and the offices of the UK (372,161) and the Russian Federation (353,088) (figure B32). Combined, these latter four top offices accounted for a further 16.1% of global registration activity.
Among the 15 top offices to have recorded a growth in registration class count in 2025, nine saw an increase of about 10% or more: Canada (+44%) had the highest, followed by Viet Nam (+36.9%), Indonesia (+31.1%), the Russian Federation (+18.7%) and Brazil (+16.8%). At the other end of the spectrum, the five offices that recorded a decline included India (–68.3%) and China (–11.9%), as noted above, followed by Türkiye (–7.9%), Argentina (–4.3%) and the Islamic Republic of Iran (–1.7%).
Active trademark registrations grew 3.6% globally in 2025
Unlike most forms of intellectual property (IP), trademarks can be maintained indefinitely through the payment of periodic renewal fees. In 2025, there were an estimated 96.6 million active trademark registrations across 157 IP offices worldwide, an increase of 3.6% compared to 2024 (figure B34).
Once again, the IP office of China had by far the highest number of trademark registrations in force in 2025, with a total of almost 51.3 million (figure B35). It was followed by the offices of the US (3.8 million), India (3.5 million), the UK (2.6 million) and Japan (2.3 million). The EUIPO and the offices of Brazil, France, Mexico and the Republic of Korea reported figures ranging from about 1.7 to 2.1 million active registrations. Indonesia (1,016,864), the Russian Federation (1,014,647) and Germany (1,014,471) reported comparable stocks of registrations in force, while Italy (537,000) and Malaysia (504,998) recorded similar, though notably smaller, counts.
Around 26.4 million trademark registrations in force at 86 offices can be broken down by the year in which they were originally registered. These represent 62.5% of the approximately 42.3 million trademark registrations recorded at these offices between 2001 and 2025. Slightly more than a fifth (21.5%) of trademarks registered in 2001 remained in force in 2025, underscoring the enduring value of marks (figure B36). For trademarks registered in 2017 or later, this share consistently exceeds 80%. More than half (52.8%) of the 26.4 million registrations in force were registered relatively recently – no earlier than 2018.
Trademark registration rates varied widely in 2025 – from 47% in the US to over 85% in Algeria and Argentina
An IP office examines trademark applications and decides whether to register them. Examination processes differ between offices, which makes inter-office comparison difficult. Every effort has, however, been made to compile examination outcome data based on common definitions and concepts. In 2025, 83 IP offices shared data with WIPO on trademark examination outcomes – registered, totally rejected, or withdrawn or abandoned.
Among selected offices reporting data, Algeria (98.6%), the EUIPO (96.7%), France (92.5%), the Benelux Office for Intellectual Property (BOIP) (89.7%) and Madagascar (89.1%) recorded the highest shares of registrations among applications processed in 2025 (figure B38). In contrast, the US (46.6%), Brazil (52.8%), Jamaica (54.6%), India (59.5%) and China (60.5%) stood out with the lowest registration shares. This lower registration activity was mirrored, in part, by higher rejection shares at some of the same offices: Colombia (29.8%), China (27.7%), the US (26.7%), Jamaica (26.5%) and Brazil (25.2%) recorded the highest total rejection shares. Beyond total rejection, a further share of applications did not proceed to registration due to withdrawal or abandonment. The proportion of withdrawn or abandoned applications was greatest at the offices of Canada (31.3%), India (27.5%), the US (26.7%), Mexico (26.2%), and Australia and Germany at 23.2% each. In absolute terms, China and the US reported 821,340 and 247,310 applications, respectively, as either withdrawn or abandoned, the most among offices with complete data.
China, India and the US – top filing offices, top pending application counts
For a trademark to be eligible for protection, it must be a sign that is distinctive and capable of distinguishing the goods or services of one undertaking from those of another. However, examination procedures vary widely between offices. At some offices, no search or substantive examination is carried out prior to registration. At others, a substantive examination is conducted, whereby the trademark is checked against earlier trademarks in the register for potential conflicts, namely, likelihood of confusion. Here, pending applications are taken to mean all trademark applications, at any stage in the process, awaiting a final decision by an office.
Among offices that supplied data on pending applications in 2025, China reported the highest number, with 1,870,122 applications, followed by India (1,278,430) and the US (868,774) (figure B39). These three offices were also the top three by trademark filing volume in 2025, so it follows that their pending numbers would also be the highest.
In 2025, processing time – defined as the number of days between the filing of a trademark application and the final examination decision – averaged just 14 days at the EUIPO, and even fewer at the office of the UK, at nine days. By contrast, processing times at the offices of Canada (1,057 days), Brazil (558 days) and the Republic of Korea (508 days) were considerably longer (figure B41). Looking specifically at the period between the first office action and the final decision, it averaged under a day at the offices of Brazil, India, Mexico and Rwanda, but was considerably longer elsewhere – averaging 441 days in Canada, 225 in Jamaica and 174 in the US.