
Trademark applications worldwide and by region
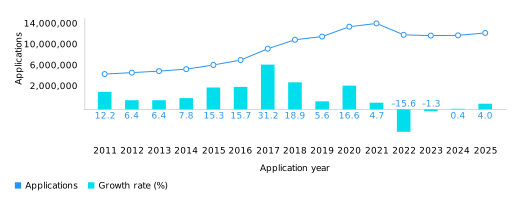 Note: World totals are WIPO estimates using data covering 171 IP offices. Totals include the number of applications filed directly at national or regional offices (the Paris route), as well as the number of designations received by offices via the Madrid System (where applicable).
Source: WIPO Statistics Database, September 2026.
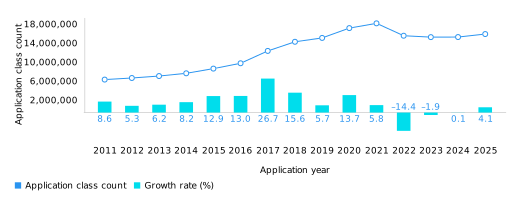 Note: World totals are WIPO estimates using data covering 171 IP offices. Totals include class counts in applications filed directly at national and regional offices (the Paris route), as well as class counts in designations received by offices via the Madrid System (where applicable). See glossary for definition of class count.
Source: WIPO Statistics Database, September 2026.
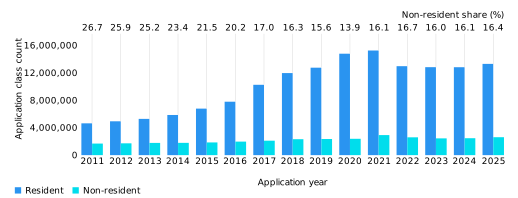 Note: World totals are WIPO estimates using data covering 171 IP offices. Totals include class counts in applications filed directly at national and regional offices (the Paris route), as well as class counts in designations received by offices via the Madrid System (where applicable). See glossary for definitions of class count, resident and non-resident.
Source: WIPO Statistics Database, September 2026.

Trademark applications by origin
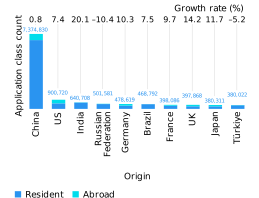
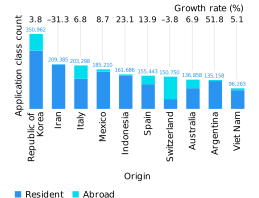 Note: Iran is the Islamic Republic of Iran. In this figure, trademark application filing by origin includes the number of classes specified in resident applications and in applications filed abroad and is based on an absolute count. For an absolute count, applications filed at regional offices are counted once, rather than being considered equivalent to multiple applications in the respective member states. The origin of a trademark application is determined by the residence of the applicant. An application filed at a regional office is considered a resident filing if the applicant is a resident of a relevant member state.
Source: WIPO Statistics Database, September 2026.
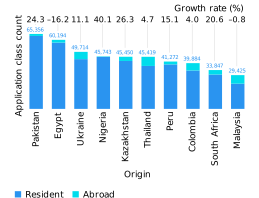
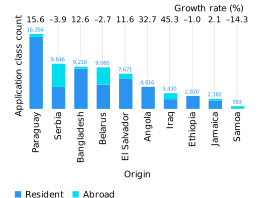 Note: In this figure, trademark application filing by origin includes the number of classes specified in resident applications and in applications filed abroad and is based on an absolute count. For an absolute count, applications filed at regional offices are counted once, rather than being considered equivalent to multiple applications in the respective member states. The origin of a trademark application is determined by the residence of the applicant. The origins selected are from different world regions and income groups (low-income, lower middle-income and upper middle-income). Where available, data for all origins are presented in statistical table B44 toward the end of this section.
Source: WIPO Statistics Database, September 2026.
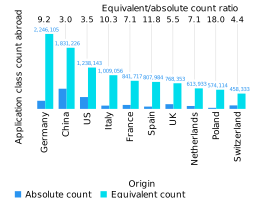
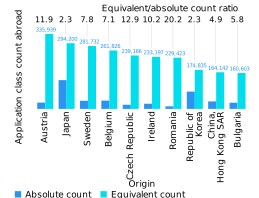 Note: Netherlands is the Kingdom of the Netherlands. This figure distinguishes between absolute and equivalent counts for filing abroad; resident applications are excluded. For an absolute count, applications filed at regional offices are counted once; for an equivalent count, applications filed at regional offices are considered equivalent to multiple applications in the respective member states.
Source: WIPO Statistics Database, September 2026.

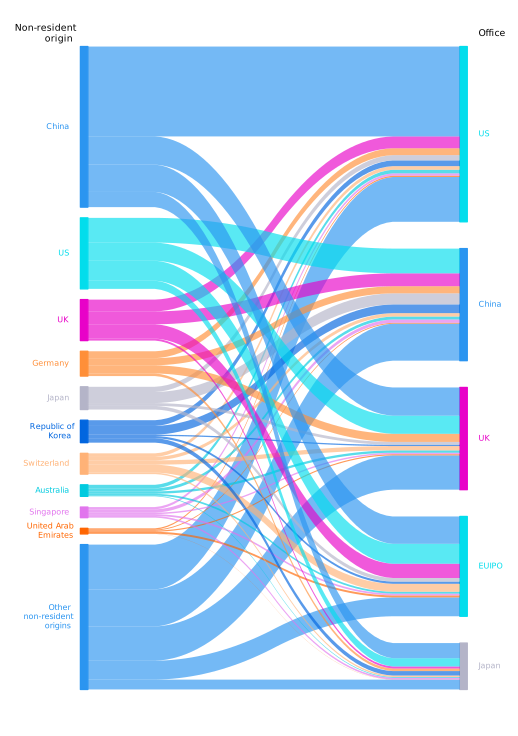 Note: EUIPO is the European Union Intellectual Property Office. Origin data are based on absolute counts. For an absolute count, applications filed at regional offices are counted once, rather than being considered equivalent to multiple applications in the respective member states.
Source: WIPO Statistics Database, September 2026.
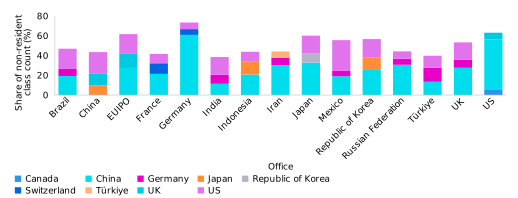 Note: EUIPO is the European Union Intellectual Property Office and Iran is the Islamic Republic of Iran. The office and origin data shown consist of absolute, rather than equivalent application class counts.
Source: WIPO Statistics Database, September 2026.
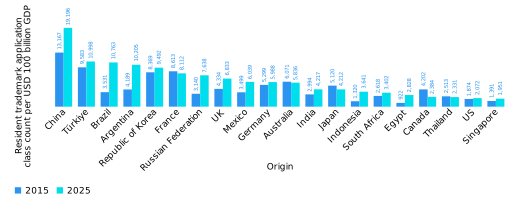 Note: GDP data are in 2021 US purchasing power parity (PPP) dollars. The selected 20 origins for 2025 were included if they had a GDP greater than USD 853 billion PPP and a resident trademark application class count of at least 16,500. This figure does not provide an overall ranking of all origins; rather, it shows a selection across geographical regions and income groups.
Sources: WIPO Statistics Database and World Bank, September 2026.
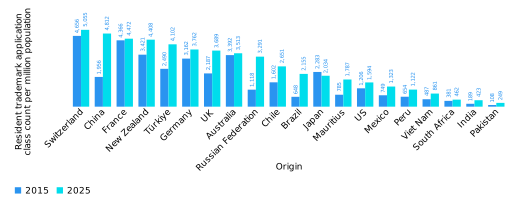 Note: The selected 20 origins for 2025 were included if they had a population greater than 1.2 million and a resident trademark application class count of at least 2,200. This figure does not provide an overall ranking of all origins; rather, it shows a selection across geographical regions and income groups.
Sources: WIPO Statistics Database and World Bank, September 2026.
Trademark applications by office
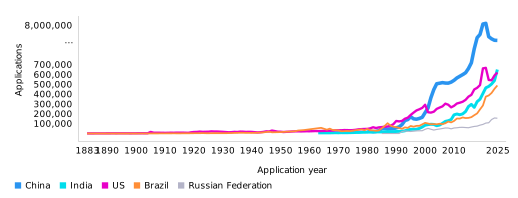 Note: Data are based on the numbers of applications filed; differences between single-class and multi-class filing systems across IP offices are not taken into account. The top five offices were selected based on 2025 application totals.
Source: WIPO Statistics Database, September 2026.
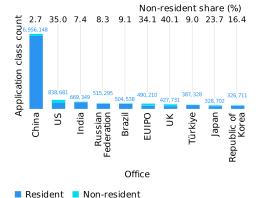
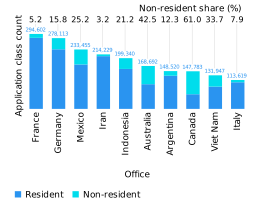 Note: EUIPO is the European Union Intellectual Property Office and Iran is the Islamic Republic of Iran.
Source: WIPO Statistics Database, September 2026.
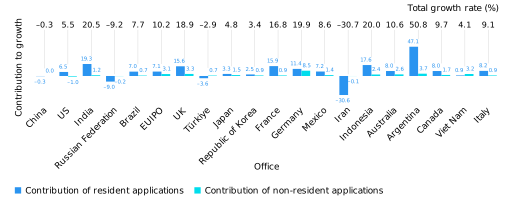 Note: EUIPO is the European Union Intellectual Property Office and Iran is the Islamic Republic of Iran. This figure shows the total growth or decrease in application class counts for each office, broken down according to the respective contributions made by resident and non-resident filing.
Source: WIPO Statistics Database, September 2026.
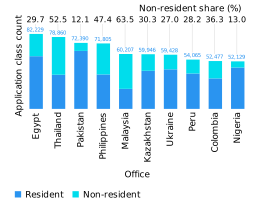
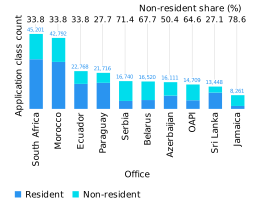 Note: The offices selected are from different world regions and income groups (low-income, lower middle-income and upper middle-income). OAPI is the African Intellectual Property Organization, which receives applications on behalf of its 17 member states. Where available, data for all offices are presented in statistical table B44 toward the end of this section.
Source: WIPO Statistics Database, September 2026.
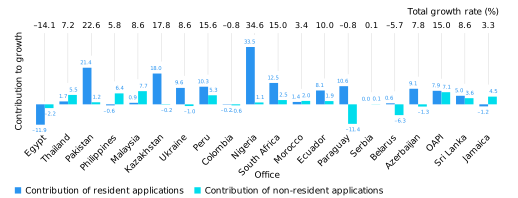 Note: The offices selected are from different world regions and income groups (low-income, lower middle-income and upper middle-income). OAPI is the African Intellectual Property Organization, which receives applications on behalf of its 17 member states. Where available, data for all offices are presented in statistical table B44 toward the end of this section. This figure shows the total growth or decrease in application class counts for each office, broken down according to the respective contributions made by resident and non-resident applications.
Source: WIPO Statistics Database, September 2026.
Trademark applications by Nice class and industry sector

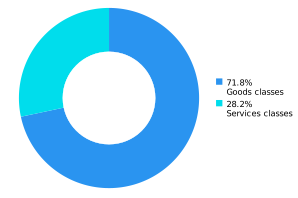 Note: In the 45-class Nice Classification, the first 34 classes indicate goods and the remaining 11 refer to services. See www.wipo.int/en/web/classification-nice for a complete list of classes. These figures are based on non-resident filing data from 141 IP offices.
Source: WIPO Statistics Database, September 2026
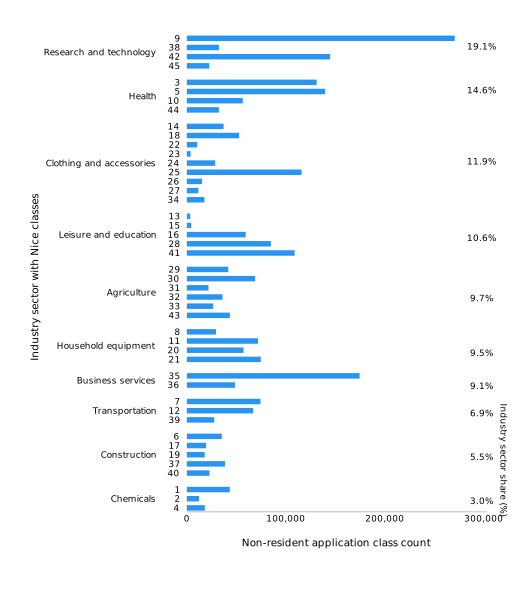 Note: Industry sectors based on class groups are those defined by Edital. Some industry sectors are abbreviated. See annex B for full definitions and the composition of Nice goods and services classes. Figures based on non-resident filing data from 141 IP offices.
Source: WIPO Statistics Database, September 2026.
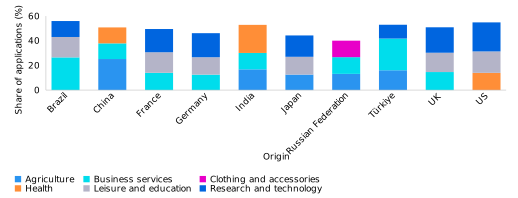 Note: Industry sectors based on class groups are those defined by Edital. Some industry sectors are abbreviated. See annex B for full definitions. The top three sectors and top origins were selected based on 2025 totals.
Source: WIPO Statistics Database, September 2026.
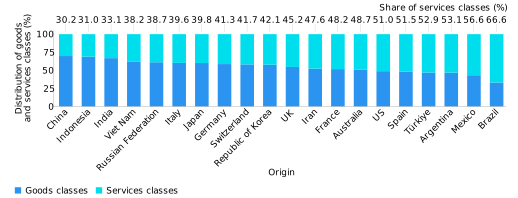 Note: Iran is the Islamic Republic of Iran.
Source: WIPO Statistics Database, September 2026.
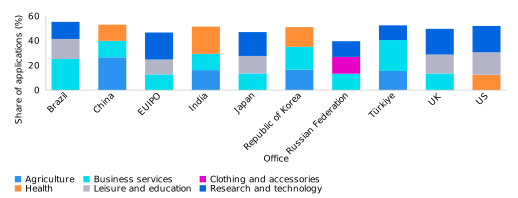 Note: EUIPO is the European Union Intellectual Property Office. Industry sectors based on class groups are those defined by Edital. Some industry sectors are abbreviated. See www.wipo.int/en/web/classification-nice for a complete list of classes. The top three sectors and top offices were selected based on 2025 totals.
Source: WIPO Statistics Database, September 2026.
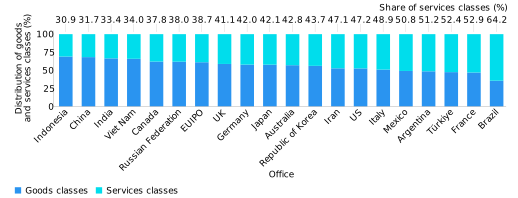 Note: EUIPO is the European Union Intellectual Property Office and Iran is the Islamic Republic of Iran.
Source: WIPO Statistics Database, September 2026.
Collective and certification trademark applications by office
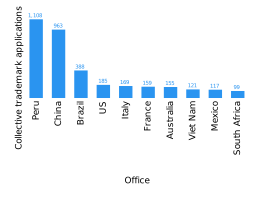
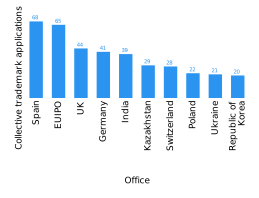 Note: EUIPO is the European Union Intellectual Property Office.
Source: WIPO Statistics Database, September 2026.
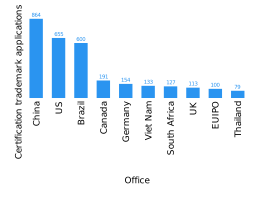
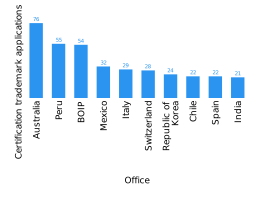 Note: BOIP is the Benelux Office for Intellectual Property and EUIPO is the European Union Intellectual Property Office.
Source: WIPO Statistics Database, September 2026.
Trademark registrations worldwide, by region and office
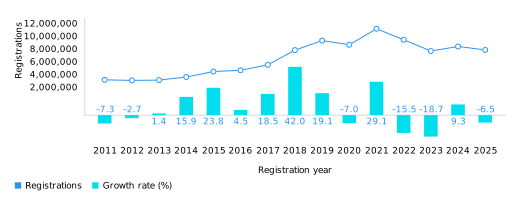 Note: World totals are WIPO estimates using data covering 171 IP offices. Totals include the number of registrations issued by national and regional offices for applications filed directly at offices (the Paris route), as well as the number of designations received by offices via the Madrid System (where applicable).
Source: WIPO Statistics Database, September 2026.
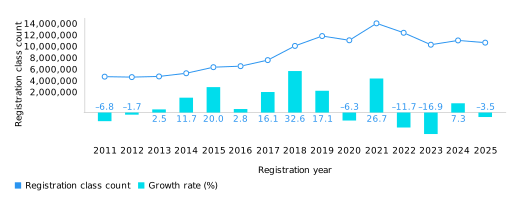 Note: World totals are WIPO estimates using data covering 171 IP offices. Totals include class counts in registrations issued by national and regional offices for applications filed directly at offices (the Paris route), as well as designations received by offices via the Madrid System (where applicable). See glossary for definition of class count.
Source: WIPO Statistics Database, September 2026.
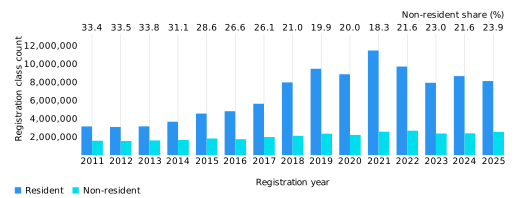 Note: World totals are WIPO estimates using data covering 171 IP offices. Totals include class counts in registrations issued by national and regional offices for applications filed directly at offices (the Paris route), as well as for designations received by offices via the Madrid System (where applicable). See glossary for definitions of class count, resident and non-resident.
Source: WIPO Statistics Database, September 2026.

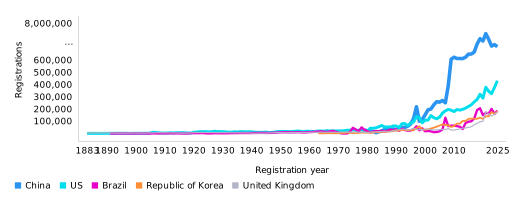 Note: Data are based on the numbers of registrations recorded; differences between single-class and multi-class registration systems across IP offices are not taken into account. The top five offices were selected based on 2025 registration totals.
Source: WIPO Statistics Database, September 2026.
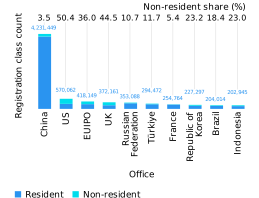
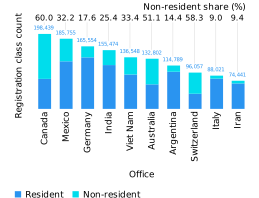 Note: EUIPO is the European Union Intellectual Property Office and Iran is the Islamic Republic of Iran. On the basis of an examination, a registration may be issued for a trademark application. The number of registrations issued may fluctuate greatly from one year to the next, in part reflecting the amount of resources that IP offices dedicate to examining trademark applications.
Source: WIPO Statistics Database, September 2026.
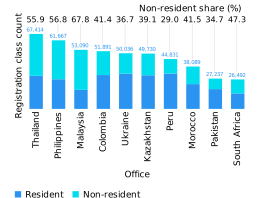
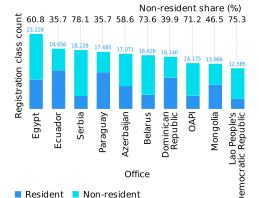 Note: The offices selected are from different world regions and income groups (low-income, lower middle-income and upper middle-income). OAPI is the African Intellectual Property Organization, which receives applications on behalf of its 17 member states. Where available, data for every office is presented in statistical table B45 toward the end of this section.
Source: WIPO Statistics Database, September 2026.
Trademark registrations in force
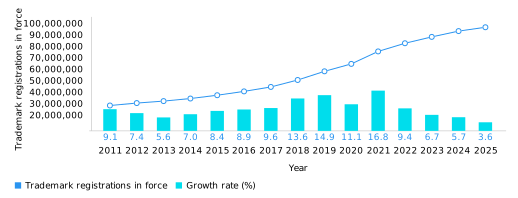 Note: World totals are WIPO estimates using data covering 157 IP offices. Data refer to the number of trademark registrations in force, not the number of classes specified in those registrations. Trademark rights can be maintained indefinitely by paying a renewal fee at defined intervals. Trademarks in force provides information on the volume of trademark registrations currently active, as well as the historical trademark life cycle.
Source: WIPO Statistics Database, September 2026.
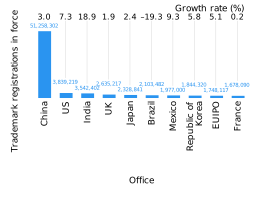
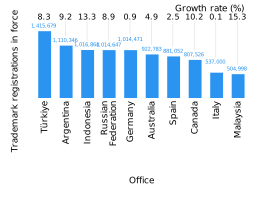 Note: EUIPO is the European Union Intellectual Property Office. Data refer to the number of trademark registrations in force, not the number of classes specified in those registrations.
Source: WIPO Statistics Database, September 2026.
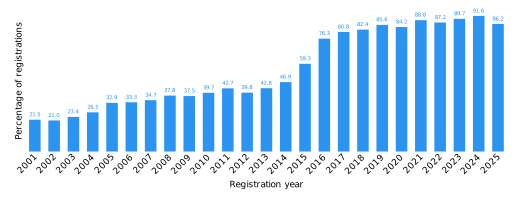 Note: Percentages are calculated as follows: the number of trademark registrations issued in year t and in force in 2025 divided by the total number of trademark registrations issued in year t. Trademark holders must pay a renewal fee to maintain the validity of their marks, which in most cases can be maintained indefinitely. This figure is based on about 26.4 million active trademark registrations reported by the 86 offices that provided a breakdown by year of registration. Detailed data for several of the larger offices, such as those of China and Japan, are unavailable.
Source: WIPO Statistics Database, September 2026.
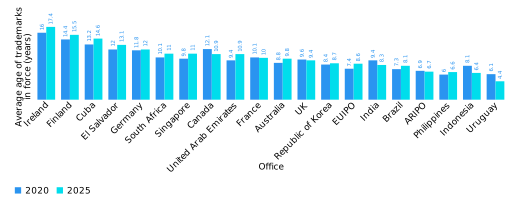 Note: ARIPO is the African Regional Intellectual Property Organization and EUIPO is the European Union Intellectual Property Office.
Source: WIPO Statistics Database, September 2026.
Trademark office procedural data
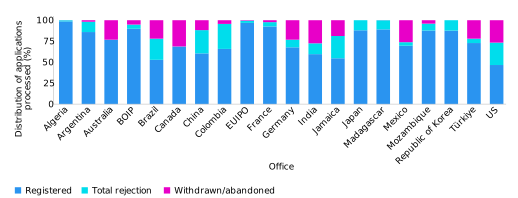 Note: BOIP is the Benelux Office for Intellectual Property and EUIPO is the European Union Intellectual Property Office. WIPO collects data from IP offices using a common questionnaire and methodology. However, due to differences in application processing procedures between offices, data cannot be fully harmonized. Therefore, caution should be exercised when making comparisons across offices.
Source: WIPO Statistics Database, September 2026.
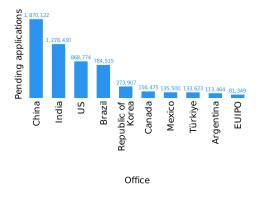
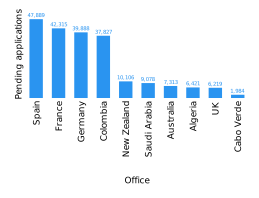 Note: EUIPO is the European Union Intellectual Property Office. WIPO collects data from IP offices using a common questionnaire and methodology. However, due to differences in application processing procedures between offices, data cannot be fully harmonized. Therefore, caution should be exercised when making comparisons across offices.
Source: WIPO Statistics Database, September 2026.
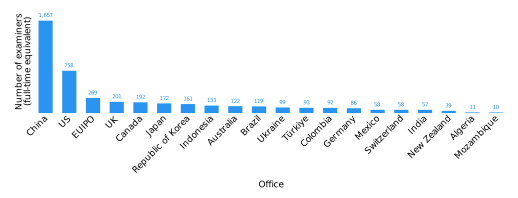 Note: EUIPO is the European Union Intellectual Property Office.
Source: WIPO Statistics Database, September 2026.
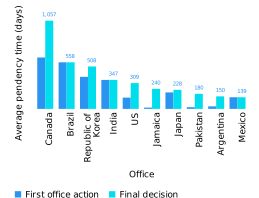
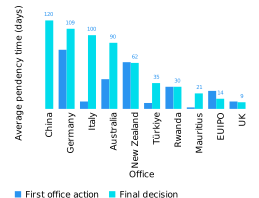 Note: EUIPO is the European Union Intellectual Property Office. WIPO collects data from IP offices using a common questionnaire and methodology. However, due to differences in application processing procedures between offices, data cannot be fully harmonized. Therefore, caution should be exercised when making comparisons across offices.
Source: WIPO Statistics Database, September 2026.
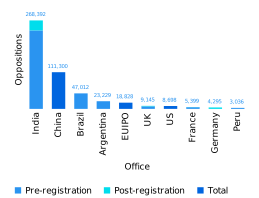
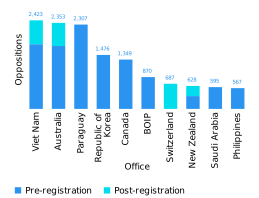 Note: EUIPO is the European Union Intellectual Property Office and BOIP is the Benelux Office for Intellectual Property.
Source: WIPO Statistics Database, September 2026.
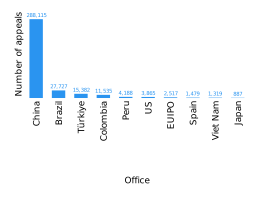
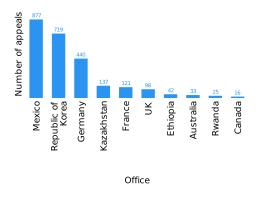 Note: EUIPO is the European Union Intellectual Property Office.
Source: WIPO Statistics Database, September 2026.
Statistical tables


