
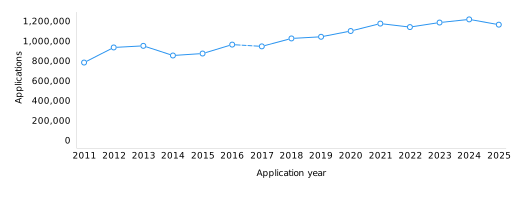
Design applications declined by 4.4% worldwide in 2025
Globally, an estimated 1.17 million design applications were filed in 2025, representing a 4.4% decrease compared to 2024 (figure 3.1). This downward trend was widespread, with about 52% of offices reporting lower filing volumes than in the preceding year. The contraction was primarily driven by the office of China, which received 68,257 fewer applications than in 2024, followed by the offices of the Islamic Republic of Iran (–1,528) and Türkiye (–1,136).
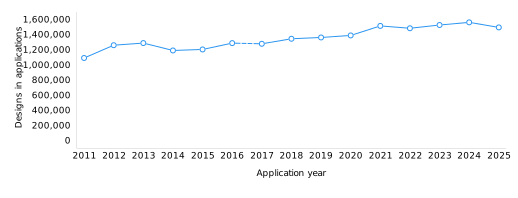
Statistics based on the number of designs contained in design applications – known as application design counts – improve worldwide comparability by harmonizing data between those offices that allow several designs to be contained within a single application and those allowing only one.
An estimated 1.49 million designs were contained in applications filed globally in 2025, down 4.3% from 2024 (figure 3.2). This overall decline was characterized by a 6% drop in resident design counts, which contrasted with a 2.5% increase in non-resident filings (figure C3). The downturn in resident applications was primarily driven by the offices of China (–71,308), Italy (–6,794) and France (–4,391). Conversely, the expansion in non-resident designs originated mainly from the European Union Intellectual Property Office (EUIPO) (+6,579), alongside the National Intellectual Property Administration of the People’s Republic of China (CNIPA) (+3,692) and United States Patent and Trademark Office (USPTO) (+2,762).
In 2025, the Hague System accounted for 33% of all non-resident designs, while the remainder was submitted directly to individual offices by applicants (figure C19). During that year, the Hague System provided coverage across 99 countries worldwide.
Asia accounted for more than two-thirds of global filing activity in 2025
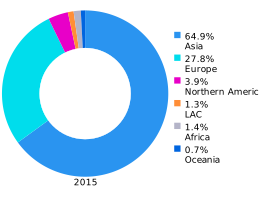
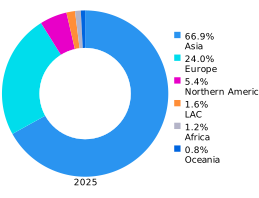
From 2015 to 2025, Asia maintained its position as the leading region for design applications, expanding at an average annual rate of 2.5% over the decade to account for 66.9% of the global total (amounting to a 1 million design count) (figure 3.3). Conversely, Europe’s share of the global count contracted from 27.8% to 24% due to a modest annual growth rate of 0.7% over the same period, even as its absolute volume rose to 359,000 designs. Northern America recorded the fastest regional expansion, growing by 5.5% annually and increasing its global share to 5.4%. Growth was predominantly driven by foreign applicants, with the region’s resident filing activity share almost halving from 50.4% in 2015 to 27% in 2025.
Together, Africa, Latin America and the Caribbean (LAC) and Oceania accounted for a relatively marginal 3.6% share of the global total in 2025, although their dynamics diverged, LAC leading this group with an annual growth rate of 4.9%. In contrast, Africa recorded a slow growth rate of 0.5%, but experienced a surge in domestic activity, its resident share climbing from 50.1% to 70.5%. Meanwhile, Oceania’s resident share of filing activity fell from 37.8% to 27.9% despite an average annual growth of 3.6%.
Applicants from the US moved up to claim second position in terms of application design count
In 2025, applicants based in China submitted applications containing 849,100 designs, representing for 56.8% of the world total (figure 3.4). The United States of America (US) moved up one spot to rank second, with 73,091 designs, surpassing Germany (64,932). Together with the Republic of Korea (60,841) and Italy (55,031), these top five origins collectively accounted for 73.8% of global design count activity for the year.
Half of the top 20 origins were European, seven Asian, and there was one each from LAC, Northern America and Oceania. By income level, the top 20 list comprised 14 high-income, four upper middle-income and one lower middle-income economies.
 Note: LAC is Latin America and the Caribbean.
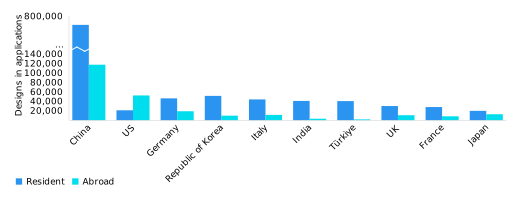
Some offices allow design applications to contain more than one design for the same good or in the same class; others allow only one design per application. In order to capture differences in application filing systems across offices, the respective application and registration design counts need to be compared.
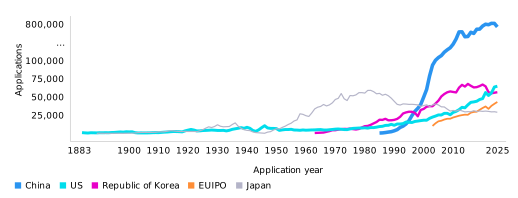
Between 1883 and the early 1950s, the IP offices of Japan and the US averaged a similar number of applications, rarely exceeding 10,000. The office of Japan received the highest number of applications per year from the 1950s through to the late 1990s, reaching approximately 50,000 annual filings at its peak. The office of China, which received 640 applications when it first began receiving applications in 1985, has undergone an unprecedented rate of growth, peaking at 822,849 applications filed in 2023. The office of the US moved ahead of Japan in 2012 followed by the Republic of Korea in 2023 to become the second largest globally. The office of the Republic of Korea moved down from second place – which it had held since 2004 – to third in 2023. The EUIPO began receiving applications in 2003 and moved up to fourth position in 2019. Among these top five offices, the EUIPO is the only one to operate a multiple design system. On average, an application filed at the EUIPO contained three designs in 2025.
 Note: EUIPO is the European Union Intellectual Property Office.
 Note: Netherlands is the Kingdom of the Netherlands.
The top 20 origins concentrated 93% of filing activity abroad in 2025
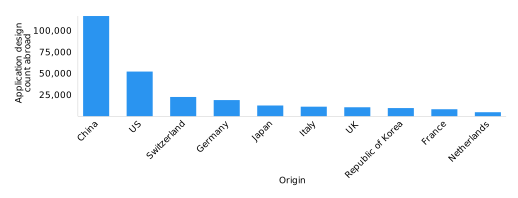
In 2025, designs in applications filed abroad grew by 2.5% to reach 316,400 (figure C7). Applicants from China led, with 117,174 designs filed overseas accounting for 37% of the world total. China was followed by applicants from the US (52,220), Switzerland (22,507), Germany (18,872) and Japan (12,536) (figure 3.5).
Together, the top 20 origins accounted for 93% of design counts filed abroad worldwide. The most rapid year-on-year growth was recorded by Poland (+150.7%), Austria (+38.8%) and Denmark (+36%). Conversely, Canada (–38.2%), Singapore (–25.1%) and Germany (–22%) experienced the sharpest declines (figure C8).
Relative to its population, the Republic of Korea had the most intensive design activity worldwide
Adjusting resident filing activity according to gross domestic product (GDP) and population is instructive when comparing the intensity of resident design filing across origins.
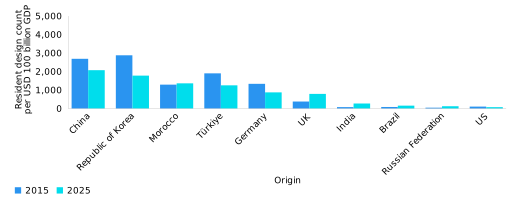
In 2025, China retained the highest resident design count per USD 100 billion of GDP, recording a ratio of 2,076 (figure 3.6). China was followed by the Republic of Korea (1,783), Italy (1,389) and Morocco (1,365). In contrast, the US (79), the Russian Federation (129) and Indonesia (147) registered considerably lower ratios (figure C11). Compared to 2015 levels, the 2025 ratios rose substantially for the United Kingdom (UK) (+413) and India (+195), whereas they fell sharply for the Republic of Korea (–1,097) and Türkiye (–647).
When resident design counts are measured relative to population, the Republic of Korea topped the global ranking, with 993 resident designs per million population in 2025 (figure C12). It was followed by Italy (745), Germany (552) and China (520). Over the past decade, the UK (+237) and China (+120) have recorded substantial increases in their respective ratios, whereas those of the Republic of Korea (–299) and Germany (–247) have declined significantly.
Madagascar had a particularly high level of design filing activity relative to its GDP
Mapping resident application design counts per capita against GDP per capita provides a visualization of an economy’s design output relative to its stage of economic development (figure C13). Origins plotted above the sloping trendline – which indicates a positive correlation between these two variables – demonstrate a particularly strong design intensity relative to their level of development. Over the 2021–2025 period, Argentina, Australia, Brazil, Guinea-Bissau and the Philippines were positioned close to this line, indicating a resident design activity in line with development level.
Conversely, economies such as China, Madagascar, Mongolia, Morocco, the Syrian Arab Republic, Türkiye and the Republic of Korea stood well above the line, signaling a particularly high level of resident design filing intensity relative to GDP. Meanwhile, Cambodia, Panama, Paraguay, Uganda and the United Arab Emirates stood below the line, reflecting a comparatively low level of design activity for their stage of development.
The office of Brazil saw a sharp increase in application design count in 2025
Applications received by offices from resident and non-resident applicants are referred to as office data, whereas applications filed by applicants at their home office(s) (resident applications) or at foreign offices (applications abroad) are referred to as origin data. Design statistics based on office data provide information on the destination of design activity, whereas statistics based on the origin of residence of the first named applicant complement the overall picture by providing information on the source of design activity.
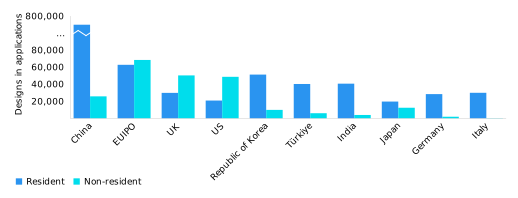
In 2025, CNIPA received the largest volume of designs in applications filed, totaling 757,713 and accounting for just over half (50.7%) of the global total (figure 3.7). It was followed by the EUIPO (131,244) and the offices of the UK (80,205), the USPTO (69,572) and the Ministry of Intellectual Property of the Republic of Korea (MOIP) (61,229) (figure C15). The composition of the top 10 offices remained unchanged from 2024.
Combined, the top 20 offices accounted for 93.6% of all design counts worldwide in 2025. Half of these offices reported growth, with four registering double-digit increases: Brazil (+17%), Spain (+14%), India (+10.6%) and Canada (+10.6%) (figure C16). In contrast, the five steepest declines were recorded by Italy (–19%), France (–18.5%), Morocco (–9.4%), China (–8.2%) and Switzerland (–6.3%).
Six of the top 20 offices reported a increase in both resident and non-resident design activity, including the EUIPO and the USPTO. Of the remaining 14 offices, six recorded a decline in resident filings only, four saw a decrease in non-resident activity and four registered a decline in both categories.
Among selected offices in low- and middle-income economies outside the top 20, a fast rate of growth in design counts was observed in Algeria (+88.2%), Kazakhstan (+40.3%), Argentina (+34.5%) and the Philippines (+21.4%) (figure C18). Conversely, the African Regional Intellectual Property Organization (ARIPO) (–44.2%), Tunisia (–30.5%) and the African Intellectual Property Organization (OAPI) (–23.7%) registered a steep decline.
Designs contained in resident applications accounted for 78.8% of the global total in 2025. This substantial share heavily reflects China’s profile, where domestic applicants accounted for 96.6% of all designs. Resident counts constituted most of the activity at 14 of the top 20 offices; by contrast, they represented less than a third of filings at the offices of Australia (29.6%), Canada (7.9%), Switzerland (28%) and the US (30%).
The textile and accessories sector accounted for the largest share of filing activity
Grouping the 32 Locarno classes into 12 industry sectors serves to highlight the most important industry sectors for designs contained within design applications filed.
In 2025, the sectors accounting for the largest shares of the global total were textiles and accessories (16.7%), furniture and household goods (16.4%), tools and machines (11.7%), ICT and audiovisual (9.2%) and electricity and lighting (8.2%) (figure C21). Combined, these five sectors represented 62.2% of all classes recorded worldwide.
For each of the top 10 offices where data is available, the top three sectors accounted for between 40% and 81% of all classes, though the dominant sectors differed by office (figure 3.8). Textiles and accessories led filings at the offices of Spain (48.2%), the Republic of Korea (26.7%) and Germany (24.7%), whereas furniture and household goods featured prominently at the offices of Türkiye (25.8%) and Germany (21.4%) (figure C22).
Among the top 10 origins, the three leading sectors combined represented at least 42% of the total design count in 2025 (figure C23). Textiles and accessories featured among the top three sectors for all 10 origins, followed by furniture and household goods, which was a top three sector for eight origins.
Applications registered worldwide grew a further 4.8% in 2025
Globally, offices registered approximately 1.02 million design applications in 2025, representing a 4.8% increase compared to 2024 (figure C24). This second consecutive year of growth returned registration volumes to levels seen in 2022.
Registrations contained 1.33 million designs, marking a 4.4% increase on the previous year (figure C25). CNIPA alone accounted for 50.7% of the global total, while the top 20 offices collectively represented 93.6%. Among the top 20 offices, 13 saw an increase in design registration counts, with Brazil (+70.9%), Viet Nam (+67%) and Indonesia (+59.2%) recording the most robust growth. Conversely, France (–11.9%), India (–11.5%) and Germany (–9.5%) registered the steepest declines (figure C29).
Nearly 6.4 million registrations were active worldwide in 2025
Design rights typically endure for up to 15 years from the filing date, although most European jurisdictions allow up to 25 years, while China limits the term to 10 years.
In 2025, an estimated 6.38 million design registrations were in force worldwide, representing a 4.7% increase compared to 2024 (figure C31). China held the largest volume, with 3.17 million active registrations, accounting for nearly half of the global total (figure C32). It was followed by the US (477,390), the Republic of Korea (416,119), the UK (412,031) and the EUIPO (398,735). Collectively, the top 20 offices represented nearly 95% of all active design registrations globally.
Eighteen of these top 20 offices expanded their active registrations, with Indonesia (+30.3%), Thailand (+18.2%) and the UK (+13.5%) recording the most robust growth. Conversely, France (–15.2%) and Germany (–5%) registered the only declines among the top 20 offices.
 Note: EUIPO is the European Union Intellectual Property Office.
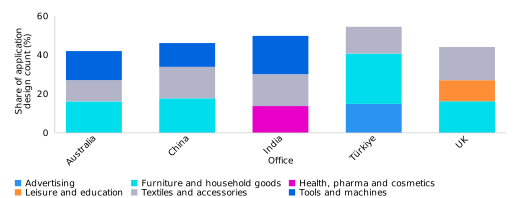
Figure C33 shows the distribution of 2.84 million active registrations across 92 offices in 2025, distributed by year of registration. More than a quarter of designs registered in 2006 remained in force in 2025. Similarly, a majority of the 2016 cohort remained active and nearly 84% of registrations from 2021 were still valid in 2025.
The average age of active registrations varies considerably across offices (figure C34). In 2025, for instance, the average age of active design registrations in Spain was 11.4 years, compared to just 3.3 years in the UK.
The office of the UK registered almost 93% of applications processed in 2025
A design office examines applications and decides whether to register them. Examination processes vary between offices, making inter-office comparison difficult. Every effort has been made to compile examination outcome data based on common definitions and concepts.
Examination outcomes vary widely depending on the office. Among the top five offices by registered design count, the EUIPO and the UK office registered the largest shares of processed applications in 2025, at 98.9% and 92.6%, respectively. High registration rates were also recorded by the offices of Hong Kong SAR (China) (97.4%), France (96.8%), India (94.6%) and Australia (93.3%) (figure C35).
Conversely, rejection rates were high at the office of the Islamic Republic of Iran (57%) and the USPTO (23.6%), whereas withdrawals and abandonments represented a substantial proportion of outcome in Thailand (30%), Mexico (20%) and the Islamic Republic of Iran (18%).
The EUIPO had a relatively low number of potentially pending applications in 2025
In general, for a design to be eligible for protection, it typically needs to meet certain criteria such as being new, original and of an individual character. However, examination procedures vary widely between offices. At some offices, no search is made and no examination as to substance is carried out prior to registration. At other offices, a substantive examination is conducted, whereby the design is checked against designs on the register for novelty and/or originality. Here, potentially pending applications are taken to be all design applications, at any stage in the process, awaiting a final decision by an office.
Among the offices providing data on potentially pending applications in 2025, the USPTO reported the highest volume, with 56,200 potentially pending applications (figure C36). It was followed by MOIP (19,367) and the office of India (18,069). In contrast, despite ranking second and third in overall design counts, the EUIPO and the UK maintained relatively small potentially pending applications, recording 6,141 and 2,836 such applications, respectively. The offices of Germany (1,576) and Türkiye (1,191) also reported modest volumes of potentially pending applications relative to overall filing activity.
On average, design applications were processed in under four days after having been filed at the EUIPO in 2025. Conversely, average processing times at the office of Thailand and the USPTO were much longer, standing at 791 and 609 days, respectively (figure C37). The interval between the first office action and the final decision averaged less than a day in Algeria, Peru, Türkiye and the United Arab Emirates, but extended to over a year in Mexico and Thailand.