
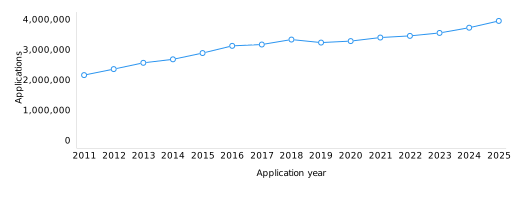
In 2025, innovators from around the world submitted a record-breaking 3.9 million patent applications, up 6.0% on 2024
In 2025, innovators around the world filed over 3.9 million patent applications, marking a 6.0% increase over 2024 and the fastest year-on-year growth since 2016 (figure 1.1). This acceleration in the rate of filing is particularly notable, as it represents the sixth consecutive year of growth following a 3% decline in 2019. Momentum has since strengthened markedly, with the annual growth rate climbing from 4.9% in 2024 to 6.0% in 2025 – the strongest performance in nearly a decade. This signals that global innovation activity has not alone rebounded from the pandemic-era slowdown, but has also surpassed its pre-pandemic momentum.
Total filings rose by 224,000 applications in 2025 compared to 2024, with growth heavily concentrated among a handful of Asian economies. China alone accounted for more than half of the increase, adding 113,693 applications. It was followed by Japan (+45,310), India (+28,690) and the Republic of Korea (+23,169). Together, these four origins accounted for roughly 94% of the net global increase. India’s performance was especially striking – filings surged by 37.5% to over 100,000 applications for the first time, underscoring the strength of that country’s rapidly expanding innovation ecosystem.
The worldwide filing of 3.9 million applications in 2025 comprised 2.9 million resident filings (73.9% of the total) and 1 million non-resident filings (26.1%). Resident filings grew by 8.0% in 2025 – the fastest rate of growth since 2016 – while non-resident filings remained largely stable, edging up by just 0.7%. Over the past decade, resident filings have grown at a considerably faster pace than non-resident filings, with average annual growth rates of 4.0% and 1.3%, respectively. In terms of volume, resident filings have risen from around 2 million in 2015 to 2.9 million in 2025, whereas non-resident filings have increased more modestly, from 0.9 million to 1 million over the same period. It is notable that the sustained surge in resident filings has driven a significant decline in the global share of non-resident filings, which has fallen from 31.4% to 26.1% over the past decade (figure A2).
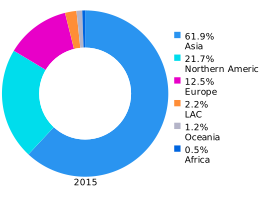
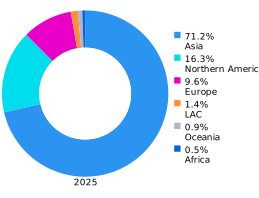
In 2025, Asia further consolidated its position as the hub of global innovation, with that region’s IP offices receiving seven out of every 10 patent applications filed worldwide
Offices located in Asia received approximately 2.8 million applications in 2025, constituting 71.2% of the world total (figure 1.2). This is to be expected considering that three of the five offices to have received the most patent applications in 2025 are located in that region. Over the course of a decade, Asia’s share of total applications filed globally has increased by 9.3 percentage points, from 61.9% in 2015 to 71.2% in 2025. This has been driven mostly by robust filing growth in China, which contributed around 68.5% of all applications filed within Asia during 2025, with the remaining offices accounting for the other 31.5%. Africa (3.4%) and Asia (4.6%) are the only two regions to record an average annual growth rate that is above the world average of 3.2% over the past decade.
Both Northern America and Europe have seen a significant decline in their share of the world total over the past decade. Northern America’s share fell from 21.7% in 2015 to 16.3% in 2025, while Europe’s declined by 2.9 percentage points down to 9.6% over the same period. The combined share of Africa, Latin America and the Caribbean (LAC) and Oceania stood at 2.9% in 2025, 1.1 percentage points lower than in 2015. Notably, while LAC is the only region to have recorded a decline in filings over the decade (–1.3% annually), its resident share has risen markedly, from 11.8% to 18.2% – mirroring a similar rise in Africa and suggesting that domestic applicants account for a growing proportion of the filing activity in both regions.
 Note: LAC is Latin America and the Caribbean.
India passed the 100,000 milestone for the first time in 2025, one of five top 20 origins to record a double-digit growth in filings
Innovators residing in China filed around 1.9 million patent applications worldwide in 2025 (resident plus abroad filings). China was followed by the United States of America (US) (489,766), Japan (466,301), the Republic of Korea (319,210) and Germany (132,714) (figure 1.3).
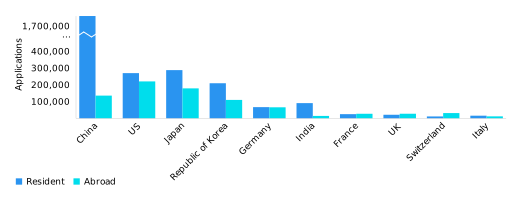
The distribution of resident and abroad filings varied considerably across the top 20 origins. The Islamic Republic of Iran recorded the lowest share of abroad filings, at just 1.0% of its total, followed by China (7.1%), the Russian Federation (7.4%) and Türkiye (8.2%) – reflecting a strong orientation toward domestic filing in each case. By contrast, abroad filings accounted for a large majority of the applications originating from Israel (90.0%), Singapore (79.6%) and Canada (78.4%). For Canada and Israel, most of these filings were made at the United States Patent and Trademark Office (USPTO).
Origin data count applications according to the country of origin of the invention – that is, the residence of the first-named applicant. This perspective combines an applicant’s filings at home (resident applications) with the filings they made at foreign offices (applications abroad), and so helps give a complete picture of innovative activity worldwide. Origin data can be compiled in one of two ways: by absolute count, where an application filed at a regional office is counted only once; or by equivalent count, where the same application is counted multiple times. The data reported in this section are based on absolute count.
Office data, by contrast, count applications according to the office where the activity takes place. This includes all applications received by an office, whether from residents or non-residents, and shows where patent protection is being sought. Office data are presented in later sections of this report.
Beyond the top 20 origins, applicants from Brazil (9,145) and the Democratic People’s Republic of Korea (6,257) filed a substantial number of applications in 2025, the majority of which were resident filings – accounting for 99.6% of the total in the Democratic People‘s Republic of Korea and 76.6% in Brazil. These two origins moved in opposite directions in terms of volume of applications, however: Brazil recorded strong growth at 14.3%, whereas filings from the Democratic People’s Republic of Korea declined by 10.1%. For each of the selected origins shown in figure A5, except for Mauritius, South Africa and Uruguay, resident filings accounted for more than half of the total, reflecting applicants’ focus on seeking patent protection within their domestic market.
Among origins with a low volume of filings, some recorded particularly rapid growth in 2025. Argentina (+46.0%), Peru (+45.2%) and Ethiopia (+44.9%) each posted increases exceeding 40%. These high growth rates should be interpreted with caution, however, as they stem from a relatively low base – Argentina, Peru and Ethiopia filed 1,050, 392 and 100 applications, respectively – meaning that even a modest increase in volume translates into a large percentage gain.
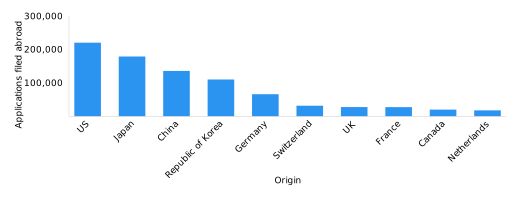
Focusing on abroad filings, US-based applicants filed the most patent applications abroad in 2025, with a total of at least 220,183. The US has held top position for abroad filings since 2013, when it surpassed Japan. The US was followed by Japan (178,719), China (135,541), the Republic of Korea (109,905) and Germany (65,859) (figure 1.4). Among these five origins, the Republic of Korea (+9.6%) and China (+8.7%) reported an increase in abroad filings in 2025. In contrast, Japan (–2.8%), Germany (–4.1%) and the US (–5.5%) recorded a decline, with the US posting a steep decrease for a third consecutive year and Japan continuing its steady decline for a sixth.
Switzerland (31,444), the United Kingdom (UK) (27,427), France (27,204), Canada (19,774) and the Kingdom of the Netherlands (17,521) round out the top 10 rankings for abroad filings. Several countries have seen substantial increases in abroad filings over the past decade. For example, China’s abroad filings grew 3.3-fold between 2015 and 2025, while Singapore and Saudi Arabia recorded 2.0-fold and 1.9-fold increases, respectively.
 Note: Netherlands is Kingdom of the Netherlands.
Analysis of the flow of non-resident applications between origins and offices shows that US applicants accounted for the largest proportion of non-resident filings in 12 of the 20 offices presented in table A6. Proportions ranged from 47.2% at the IP office of Canada to 21.4% at that of Viet Nam. The US share was particularly high at the offices of Canada (47.2%), Australia (44.1%) and Mexico (43.5%).
Applicants residing in Japan held the largest non-resident share of filings at three offices: China (28.7%), Germany (33.0%) and the US (20.2%). At the German office, Japanese applicants (33.0%) accounted for a slightly larger share than US applicants (31.5%), reflecting the importance both these economies attach to protecting inventions in the German market. China-based applicants, meanwhile, accounted for the largest non-resident share at three offices – the Islamic Republic of Iran (21.5%), the Russian Federation (30.1%) and Türkiye (24.0%) – underscoring the growing importance of these markets to Chinese applicants.
The influence of geographical proximity was also evident among neighboring European economies. Applicants resident in Germany accounted for 30.0% of all non-resident applications filed in France, while Swiss applicants accounted for 31.6% of those filed in Italy.
The relative importance of individual markets to foreign applicants is further illustrated at the offices of the Republic of Korea and China. At the Republic of Korea office, US applicants (29.0%) accounted for the largest non-resident share, followed closely by those from Japan (28.2%). At the China office – the world’s largest by volume – Japanese applicants led non-resident filings (28.7%), ahead of the US (24.1%) and the Republic of Korea (14.9%), reflecting the strong interest of neighboring Asian economies in securing protection in the Chinese market.
Residents of the Republic of Korea filed the most patents by GDP in 2025
Variations in patenting activity across countries reflect differences in the size and structure of economies. It is therefore informative to examine resident patent activity in relation to variables such as population, research and development (R&D) spending, and gross domestic product (GDP).
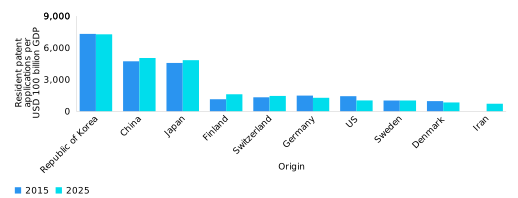
In 2025, the Republic of Korea filed the highest number of resident patent applications, with 7,271 per USD 100 billion of GDP, followed by China (5,034) and Japan (4,828) (figure 1.5). Finland (1,608) had the fourth highest patent-to-GDP ratio, followed by Switzerland (1,450), Germany (1,275) and the US (1,025). Sweden (1,019), Denmark (834) and the Islamic Republic of Iran (713) round out the top 10 origins. Several countries with a relatively low resident patent application count, among them Iceland and Luxembourg, rank among the top 20 origins once resident applications are adjusted according to GDP (figure A8). The list of top 20 origins predominantly comprises high-income countries, which tend to have a high R&D expenditure. However, three middle-income countries – China, India and the Islamic Republic of Iran – also feature.
Among top origins, India recorded by far the most striking improvement, with its patent-to-GDP ratio more than quadrupling, from 150 in 2015 to 618 in 2025 – reflecting resident filings growing far faster than GDP. China and Finland also made notable gains over the decade. In contrast, two origins with historically high ratios – Germany and the US – recorded a downward trend, as resident filings fell, while GDP continued to grow. The US decline is particularly pronounced, with its ratio falling from 1,425 in 2015 to 1,025 in 2025.
 Note: Iran is the Islamic Republic of Iran.
The ranking of resident applications per million population mostly mirrors the patent-to-GDP ranking, but with some differences. The Republic of Korea leads here too, with 4,050 patents per million, followed by Japan (2,331) and China (1,262). But India – which features according to patent-to-GDP – does not appear in the top 20 (figure A9), reflecting its large population. Long-term trends broadly echo those for patent-to-GDP: the Republic of Korea, China and Finland have improved markedly, whereas Germany and the US have declined. Japan’s ratio, fell from 2,036 in 2015 to a low of 1,749 in 2022, before rebounding strongly to 2,331 in 2025 driven by a surge in resident filings.
China’s IP office received 1.9 million patent applications in 2025, more than three times the number submitted to the US Patent and Trademark Office
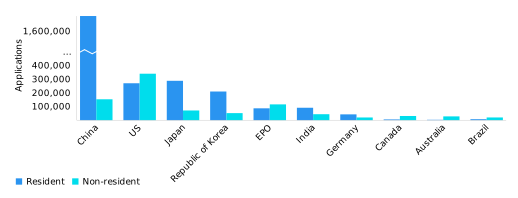
The National Intellectual Property Administration of the People’s Republic of China (CNIPA) received 1.9 million patent applications in 2025, up 5.4% on 2024.
 Note: EPO is the European Patent Office.
Among the top 20 offices, there is a substantial variation in the source of applications (figure A13). Non-resident applicants accounted for around nine out of every 10 applications received by the offices of China, Hong Kong SAR (95.6%), Mexico (92.7%) and Australia (90.9%). In contrast, non-resident applications made up only around one in 10 – or fewer – of those received by the offices of China (7.9%), France (7.9%), Italy (9.3%), Türkiye (3.1%) and the Islamic Republic of Iran (2.5%). The IP office of India has experienced one of the largest shifts in the resident and non-resident distribution over the past decade, with the resident share rising from 27.6% in 2015 to 67.5% in 2025. In contrast, whereas the Russian Federation’s resident share increased from 64.3% to 82.3% over the same period, this stemmed largely from a sharp decline in non-resident filings.
In 2025, all five of the top offices reported growth in filings. Japan stood out with a striking 16.8% increase – by far its strongest since 1972 and driven almost entirely by a surge in resident filings (+50,400 additional resident filings). China (+5.4%) and the Republic of Korea (+5.9%) also grew solidly on the back of resident filings, while the EPO (+1.3%) and the USPTO (+0.9%) recorded more modest gains.
A majority of the top 20 offices – 15 out of 20 – received more applications in 2025 than in 2024 (figure A14). Among the biggest increases were those at the offices of the Islamic Republic of Iran (+31.4%), India (+27.8%), the UK (+19.8%), Italy (+18.2%) and Japan (+16.8%). For India, this marked a ninth straight year of growth and a fourth successive year of double-digit growth. Indeed, a strong increase in resident filings was the primary driver of overall growth at each of these five offices.
Five of the top 20 offices received fewer applications in 2025 than in 2024. China, Hong Kong SAR (–7.3%) recorded the sharpest decline, followed by Singapore (–4.0%) and Mexico (–2.1%), while the Russian Federation (–0.8%) and Australia (–0.4%) registered only marginal decreases. In each case, a drop in non-resident filings was the main contributor.
Looking beyond the top 20 to selected offices of low- and middle-income countries, those of Indonesia (10,366), South Africa (9,208) and Thailand (9,087) received the most applications in 2025 (figure A15). At each of these three offices, the majority of applications were filed by non-resident applicants. Algeria (+36.4%), albeit from a relatively low base, reported the fastest growth, followed by Tunisia (+20.9%), Kazakhstan (+17.9%) and Uzbekistan (+14.1%). Algeria’s increase was propelled by strong growth in both resident and non-resident filings, which contributed 16.1 and 20.3 percentage points respectively to the overall rise (figure A16). At the other three offices, growth was driven primarily by resident filings.
Among the three regional offices, the Eurasian Patent Organization (EAPO) (+11.9%) and the African Regional Intellectual Property Organization (ARIPO) (+8.6%) returned to growth in 2025, following two consecutive years of decline. In contrast, the African Intellectual Property Organization (OAPI) (–10.0%) recorded a further fall, driven by a drop in non-resident filings.
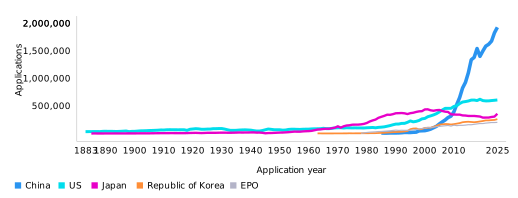
Every year from 1883 to 1963, except for 1942–1943 and 1949–1950, the patent office of the US was the world’s leading patent filing office.
 Note: EPO is the European Patent Office.
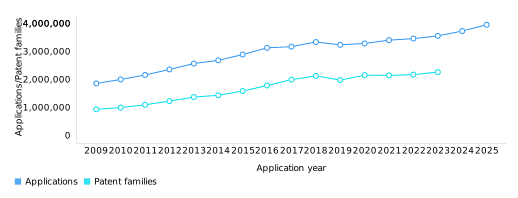
Patent filings for unique inventions more than doubled, increasing from 0.9 million in 2009 to 2.3 million in 2023
Patent rights are territorial in nature. In order to protect an invention in several countries, applicants often file a patent application for the same invention in multiple jurisdictions. This being the case, adding patent data from different jurisdictions would inflate the number of new inventions. Patent family data are therefore frequently used in order to eliminate (or at least minimize) double counting. The basic idea behind a patent family is to group together all applications – original and subsequent filings – related to each other via priority filing(s). WIPO has developed indicators for patent families with the aim of capturing the actual number of unique inventions by excluding double counting so far as possible. The drawback of such data is the consequent time lag, which can be up to three years in duration.
Patent family numbers worldwide have fluctuated over the past several years. There was a steep decline in 2019 (–7%), before the numbers rebounded in 2020 (+8.9%). Following a marginal decline in 2021 (–0.4%) and modest growth in 2022 (+1.3%), the number of patent families rose more strongly in 2023, by 4% to reach 2.3 million – the fastest rate of growth since 2020 (figure A27). The longer-term trend shows the number of patent families increasing significantly, from 0.9 million in 2009 to 2.3 million in 2023 (figure 1.7).
In 2023, applicants from China accounted for 71.2% of all patent families, followed by those from Japan (8.1%), the Republic of Korea (6.7%), the US (6.2%) and Germany (2.1%). Together, these five origins represented 94.2% of the world total. China’s patent families have grown rapidly, nearly doubling from around 827,700 in 2015 to 1.6 million in 2023, whereas those of the US have declined steadily over the same period, from 165,500 to 139,800. Japan’s patent families also declined over most of the recent decade, though they rebounded modestly in 2023 (+3.9%) to 182,394. The Republic of Korea and Germany have each maintained a relatively stable number of patent families over the same period.
The US created the most foreign-oriented patent families, with 155,263 for the period 2021–2022, accounting for 19.7% of the world total (figure A30).
The size of a patent family (indicating the number of offices at which a patent is filed) reflects its geographical coverage. Around 86% of patent families created worldwide between 2021 and 2023 were filed at a single office (figure A28). This high percentage is mainly attributable to the filing behavior of Chinese applicants, who mostly file at a single office – 96.9% of patent families originating from China are single-office families. There is, however, considerable variation among top origins. More than 70% of all patent families originating from the Kingdom of the Netherlands (72.9%), Sweden (72.8%) and Switzerland (72.1%) covered two or more offices. In contrast, only around 5% or less of the patent families originating from China (3.1%) and the Russian Federation (4.9%) were filed at more than one office. Origins whose patent families had the widest geographical coverage were Switzerland and the Kingdom of the Netherlands, where 20.7% and 15.5% of families, respectively, covered more than five offices; Switzerland also recorded the largest average family size, at 4.1 offices. This could be partly because these countries combine a small domestic market with having a high number of multinational companies headquartered within their borders.
A patent family is a set of interrelated patent applications filed at one or more offices to protect the same invention. Patent applications within a family are interlinked by one or more of the following: priority claim, Patent Cooperation Treaty (PCT) national phase entry, continuation, continuation-in-part, internal priority, and addition or division. A special subset comprises foreign-oriented patent families – that is, those patent families that have at least one filing office different from that of the applicant’s country of origin. Some foreign-related patent families have only one filing office. This is because applicants may choose to file only at a foreign office. For example, if a Canadian applicant files a patent application directly with the United States Patent and Trademark Office (USPTO) without having previously filed with the patent office of Canada, that patent family will constitute a foreign-oriented patent family with just one office.
Patent filings in computer technology have grown by 9.5% over the past decade and now represent 13.6% of global filings
In 2024 – the latest year for which complete data are available, owing to the delay between application and publication – computer technology remained the most frequently featured technology in published patent applications worldwide, accounting for 13.6% of the world total (table A17). It was followed by electrical machinery (7.5%), measurement (6.5%), digital communication (5.6%) and medical technology (4.6%). These five fields have consistently ranked among the top five for over a decade, though their relative positions have shifted over time. Together, their share of total filings has risen from 29.8% in 2014 to 37.7% in 2024, driven primarily by a rapid growth in computer-related technologies. Computer technology alone recorded an average annual growth rate of 9.5% between 2014 and 2024 – significantly outpacing the other four fields. It is notable that, unlike previously, no field of technology recorded double-digit average annual growth over this period. Computer technology (+9.5%) and IT methods for management (+9.0%) grew fastest, followed by chemical engineering (+7.0%) and measurement (+6.9%). At the other end of the spectrum, filings declined in several fields, most sharply in food chemistry (–4.2%) and engines, pumps and turbines (–2.2%).
Focusing on the specialization patterns of countries across different technology fields using the relative specialization index (RSI) shows that China and the US stand out with positive RSI values in computer technology, indicating that this field accounts for a larger share of their total patenting activity than the global average (figure A18). In digital communication, Finland, Sweden, the US, India and the Republic of Korea have positive RSI values, with Finland (0.72) and Sweden (0.64) showing particularly strong specialization.
In electrical machinery, apparatus and energy, Germany, Japan and the Republic of Korea exhibit positive RSI values, suggesting specialization in this area. Medical technology and pharmaceuticals show strong specialization in Israel, the Kingdom of the Netherlands, Switzerland and the US, highlighting a relative strength in these two fields – with Israel standing out most in medical technology (0.63) and Switzerland in pharmaceuticals (0.46). Meanwhile, transport technologies are dominated by France, Germany, Italy and Sweden, reflecting Europe’s advantage within this sector. Overall, European countries tend to specialize more in transport-related technologies, whereas Asian countries and the US show stronger specialization in computer technology and digital communication.
Green technology patent applications rose by 8.8% in 2024, reaching around 613,000 published applications
The number of published patent applications related to green technologies has increased steadily, from around 244,200 in 2010 to approximately 612,600 in 2024 (figure A19), representing an increase of 8.8% on the previous year. Growth has been broadly positive throughout the period, with the fastest annual increases recorded in 2012 (+15.5%) and 2017 (+13.8%). The only decline over the past 15 years occurred in 2019 (–0.4%).
The composition of green technology filings has shifted markedly over the past decade (figure A20). Energy storage (batteries) is now the single largest field, accounting for 17.4% of all green technology filings in 2024, having grown at an average annual rate of 10.3% between 2014 and 2024. It is followed by smart energy, grid and transmission (15.2%), which recorded the strongest growth of any major field (+13% annually), and air pollution control (11.8%). Together with solar energy (7.2%) and wastewater and sewage treatment (6.2%), these five fields accounted for more than half of all green technology filings in 2024. Among smaller but rapidly emerging fields, electric vehicle (EV) charging infrastructure stands out, having surged from just 58 filings in 2014 to over 9,000 in 2024 – an average annual growth rate of 65.8%. Sustainable aviation (+15.7%) and agriculture and forestry (+20.6%) also grew strongly. By contrast, several more established fields declined over the decade, including efficient lighting, efficient combustion, hybrid vehicles and hydropower – the last reflecting a shift in innovation toward newer clean-energy and storage technologies.
Applicants from China accounted for by far the largest share of green technology filings in 2024, at 58.8% of the world total, followed by Japan (9.6%), the Republic of Korea (9.3%), the US (8.5%) and Germany (4.1%) (figure A21). Together, these five origins represented around 90% of all green technology filings, underscoring the high concentration of green innovation among a small number of leading economies.
While China dominated in absolute terms, Denmark led among the top origins in green technology intensity, with 31.9% of its published patent applications classified as green technologies in 2024 (figure 1.8). Spain (26.0%), Poland (25.9%), the Republic of Korea (22.1%), Australia (21.3%) and Belgium (20.8%) also demonstrated a strong strategic focus on green innovation relative to overall patenting activity – all above the global average of 17.7%. In contrast, Italy recorded the lowest green intensity among the top origins at 13.8% – notably below the global average.
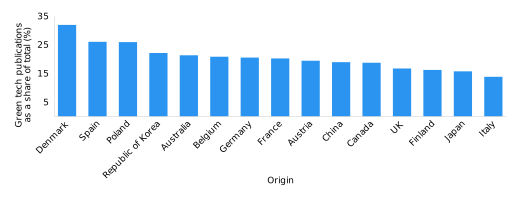
Figure A22 presents the RSI for the top origins, where a positive value indicates that a country specializes in a given field. Solar energy is led by Singapore, Spain, Israel and the Republic of Korea. Smart energy, grid and transmission is dominated by China, the only origin to record a positive value. Electric vehicles are led by Sweden and Germany by a wide margin, followed by France, Japan and Italy. Air pollution control activity is concentrated in the US, the UK, Israel and Australia. Biofertilizers and soil amendments are led by India, Poland, Brazil and Australia.
Worldwide patent grants fell by 4.4% in 2025, the first annual decline since 2000
Offices carry out a formal and substantive examination before deciding whether to issue a patent. The procedure for granting a patent varies between offices, and differences in the number of patents granted depend on factors such as examination capacity and procedural delays. For this reason, application data for a given year should not be compared with grant data for that same year.
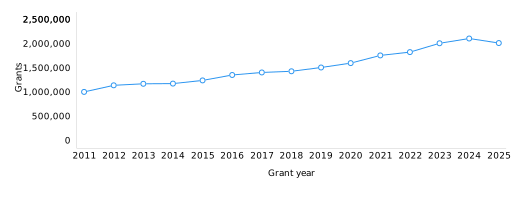
In 2025, an estimated 2 million patents were granted worldwide, representing a 4.4% decrease from 2024 (figure 1.9) – the first annual decline since 2000. Resident grants fell by 2.9% to 1.43 million, while non-resident grants dropped more sharply, by 8.1%, to 578,000. As a result, the non-resident share of grants continued its long-term decline, falling to 28.7% in 2025 from 39% a decade earlier (figure A34). The overall contraction was driven by a substantial decrease in the number of patents issued by the IP offices of China, India and Japan. China issued around 72,800 fewer patents in 2025 than in the previous year, while India and Japan issued 45,000 and 15,500 fewer, respectively, over the same period.
Asia’s share of worldwide patent grants stood at 69.6% in 2025, an increase of 13.2 percentage points on its share a decade earlier in 2015. This reflects the fact that three of the top five patent issuing authorities – China, Japan and the Republic of Korea – are located within the region, with China alone accounting for almost half (48.3%) of the world total. Offices located in Northern America accounted for 16.7% of patent grants worldwide in 2025, while those in Europe contributed 10.5% (table A35). The combined share for Africa, LAC and Oceania amounted to 3.2%. Over the past decade, the share of all regions except Asia and LAC has declined.
Since 2015, applicants residing in China have been granted the highest number of patents globally. In 2025, applicants residing in China received 986,423 patents – more than three times the number granted to those in the US (263,338), which ranked second (figure A36). China and the US were followed by Japan (237,780), the Republic of Korea (174,197) and Germany (66,885). The ranking of the top five origins has remained unchanged in recent years.
Only four of the top 20 origins were granted more patents in 2025 than in 2024. The Republic of Korea (+13%) recorded the strongest growth, followed by Türkiye (+6.5%), the Russian Federation (+4.8%) and Finland (+1.9%). In each case, a rise in resident grants drove the increase, most strikingly for the Republic of Korea, whose resident grants surged by 23.2%. The remaining 16 origins all underwent a decline. India recorded by far the steepest fall (–41.2%), its resident grants dropping from 19,746 to 7,822. In absolute terms, Japan registered the biggest decrease (–30,177 grants), with both resident and abroad grants falling.
Among selected origins, applicants from the Democratic People’s Republic of Korea (3,698), Brazil (2,916) and Mexico (1,337) received the most patents in 2025 (figure A37). Several selected origins recorded strong growth, driven primarily by resident grants: Viet Nam nearly doubled its grants (+93.8%), while Uzbekistan (+61.4%), Sri Lanka (+18.3%) and Mexico (+18.1%) also posted substantial increases. Such high growth rates should be interpreted with caution, however, as they stem from a relatively low base, where even modest changes in volume translate into large percentage gains. In contrast, the Philippines (–27.2%), the Islamic Republic of Iran (–19.2%), Malaysia (–18.7%), Tunisia (–15.6%) and Thailand (–15.0%) were granted fewer patents than in 2024.
Worldwide patents in force rose to 21.4 million in 2025, a 6.5% increase on the previous year
Patent rights generally last for up to 20 years from the date an application is filed. An estimated 21.4 million patents were in force in 2025 (figure A43), representing a 6.5% increase on 2024. Growth was driven mainly by China, which had an additional 628,688 patents in force in 2025 compared to the previous year.
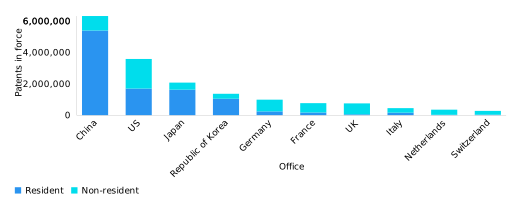
In 2025, four offices had at least 1 million patents in force. China (6.3 million) had the highest number, followed by the US (3.6 million), Japan (2.1 million) and the Republic of Korea (1.4 million) (figure 1.10). France, Germany, Italy and the Kingdom of the Netherlands also feature in the top 10, their totals partly reflecting the introduction of the EPO’s Unitary Patent system in 2023.
Beyond the top 10, the most striking feature of 2025 was the surge in patents in force at a number of smaller European offices, reflecting the continued expansion of the EPO’s Unitary Patent system. Romania recorded exceptional growth of 270% – its total leaping from 27,474 to 101,696 – following its accession to the Unitary Patent system in 2024. Malta (+66.6%), Estonia (+59.2%), Latvia (+58.8%), Lithuania (+56.6%), Bulgaria (+55.7%) and Slovenia (+46.2%) likewise saw totals rise sharply, as did Portugal (+37%), Finland (+28.9%) and Denmark (+26.1%). In contrast, India – having sustained six consecutive years of double-digit growth – saw its patents in force edge down for the first time since 2015, by 1.9% to 224,162.
 Note: Netherlands is Kingdom of the Netherlands.
The source of patents in force at the top 10 offices differs considerably (see figure 1.10). At least three-quarters of all patents in force in France (77.1%), Germany (75.2%), the Kingdom of the Netherlands (92.4%), Switzerland (88.4%) and the UK (92%) originated from non-resident applicants. In contrast, around four-fifths of all patents in force in China (85.4%) and Japan (78.3%) were held by resident applicants. This is somewhat to be expected, owing to the high share of resident patent grants at the offices of China and Japan (figure A39). Beyond the top 10, non-resident patent holders contributed more than 80% of all patents in force at most offices. There are a few exceptions, however – such as the Islamic Republic of Iran and the Russian Federation – where resident applicants are the main source of patents in force.
A holder must pay a maintenance/renewal fee in order for a patent to remain valid, and may opt to let a patent lapse before the end of its full term. Of the 85 offices that provided in-force data categorized by year of filing, approximately 33.8% of granted patents remained in force for at least 10 years after the filing date. Additionally, about 16.3% of patents lasted the full 20-year term (figure A46).
Although patents can be maintained for up to 20 years, their average age varies between offices. Among the 20 selected offices reported in figure A47, the average age of patents in force in 2025 ranged from 11.7 years in Brazil down to 6.5 years in Italy. Patents in force in Germany (11.2 years) and Mexico (10.5 years) shared a similarly high average age with those in Brazil. When comparing the average age of patents across the 20 offices in 2025 with 2020, there is an overall similarity, with two notable exceptions – Sweden and India – where the average age fell by 1.9 years and 1.7 years, respectively, over the period.
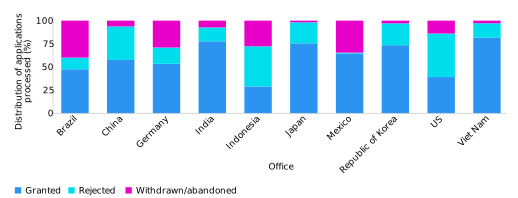
In 2025, grant shares among the largest IP offices ranged from 29% at the Indonesia office to over 80% in Viet Nam, while withdrawals were highest in Brazil and Mexico
A patent office examines applications and decides whether to grant patent rights. Examination processes differ between offices, which makes cross-country comparison difficult. Every effort has been made to compile examination outcome data based on common definitions and concepts. In 2025, 85 IP offices shared data on patent examination outcomes – granted, rejected or withdrawn – with WIPO.
Among the top 10 offices to have reported data, Viet Nam (81.4%), India (77.7%), Japan (75.5%) and the Republic of Korea (73.5%) recorded the highest shares of grants among applications processed in 2025 (figure 1.11). Indonesia and the US stood out by having the lowest grant shares – at 29% and 39.1%, respectively – and the highest rejection shares, at 43.4% and 47%, respectively. China (36.2%), Japan (22.7%) and the Republic of Korea (23.6%) likewise recorded relatively high rejection shares. The proportion of withdrawn or abandoned applications was greatest at the offices of Brazil (39.9%) and Mexico (34.6%). In absolute terms, China and the US reported around 104,000 and 115,000 applications, respectively, as being either withdrawn or abandoned, the most among offices with complete data.
Among the five offices with the highest number of pending applications, both Germany and the Republic of Korea reported lower volumes in 2025 compared to 2024
Patent offices must assess whether the claims presented in an application meet the standards of novelty, non-obviousness and industrial applicability defined in national law. Processing patents therefore consumes time and resources. The estimated total number of potential applications pending worldwide climbed to 4.8 million in 2025, a modest increase on the previous year. This estimate is based on data collected from 120 offices, but excludes China, for which only partial 2025 data are available; the partial data show 744,738 applications in the examination process.
In 2025, the US had approximately 1.26 million pending patent applications, followed by Japan (875,641), the EPO (710,065), the Republic of Korea (388,513) and Germany (367,045) (figure A49). Among these five, both the Republic of Korea (–1.4%) and Germany (–0.2%) reduced their stock of pending applications in 2025, whereas the US (+2.1%), the EPO (+2.0%) and Japan (+8.8%) recorded an increase.
Where offices have a large proportion of applications awaiting a request for examination, the scope to reduce the stock of pending applications is somewhat limited. This is because an office cannot begin the substantive examination process until an applicant has filed a request for examination. In 2025, applications awaiting such a request accounted for around 70% of the total in Israel (71.4%) and Japan (69.7%), and roughly two-thirds in the Republic of Korea (65.9%), the US (61.4%) and Australia (60.7%).
This is defined as all patent applications, at any stage in the process, awaiting a final decision by a patent office, including those applications for which applicants have not filed a request for examination (where applicable).
Women inventors accounted for no more than 18.1% of all inventors listed in published PCT applications in 2025
In 2025, women constituted 18.1% of all inventors listed in published PCT applications, while men accounted for the remaining 81.9% (figure A23). The proportion of women inventors has risen notably over the past 15 years, from 11.5% in 2011 to 18.1% in 2025. However, the pace of increase has slowed markedly in recent years: after annual gains of around 0.5 to 1 percentage point through much of the past decade, the share edged up by just 0.2 percentage points in 2025.
About 38.1% of published PCT applications named at least one woman as inventor in 2025, and 96% featured at least one man as inventor (figure A24). The share of published PCT applications with at least one woman as inventor has risen steadily from 23% in 2011 to 38.1% in 2025, whereas the share with at least one man as inventor has edged down slightly over the same period, from 97.5% to 96%. Despite this upward trend, the share of applications naming at least one woman as inventor remains considerably lower than the share naming at least one man.
The gender gap among PCT inventors varies considerably between countries. Among the top 20 origins of published PCT applications, Spain (28.7%), Türkiye (25.3%) and China (24%) had the highest proportions of women inventors in 2025 (figure A25). In contrast, in Germany (12.6%), India (12.6%), Japan (12.1%) and Austria (10.9%) only around one in 10 inventors named in published PCT applications were women. Notably, although India had one of the lowest shares of women inventors, it recorded one of the highest shares of applications naming at least one woman inventor (45.4%) – second only to China (52.6%).
Fields of technology related to the life sciences continued to record comparatively high shares of published PCT applications with women as inventors in 2025. Women represented around a third of inventors named in applications in the fields of biotechnology (32.7%), food chemistry (32.4%) and pharmaceuticals (31.3%) (figure A26). At the other end of the spectrum, women accounted for fewer than one in 10 inventors in more mechanical fields such as mechanical elements (8.8%) and engines, pumps and turbines (9.2%).
Utility model applications worldwide fell by 16.3% to 2.7 million in 2025, driven by a sharp decline in filings from China
A utility model (UM) is a special form of patent right granted by a state or jurisdiction to an inventor or the inventor’s assignee for a fixed period of time. The terms and conditions for granting a UM differ slightly from those for normal patents, including a shorter term of protection and less stringent eligibility requirements.
Filing activity for UMs fell by 16.3% in 2025, following three consecutive years of strong growth. This decline was driven almost entirely by China, which recorded 534,640 fewer applications than in 2024 (figure A55). The total number of UM applications filed worldwide amounted to 2.7 million, of which resident applications constituted 99.4% of the total, with abroad applications making up the remaining 0.6%. Despite the fall, worldwide filings have nonetheless increased 2.3-fold over the recent decade, from just over 1.2 million applications in 2015 to 2.7 million in 2025. In 2025, applicants based in China accounted for approximately 97.2% of the global total, compared with 93% in 2015.
Applicants residing in China filed 2.6 million applications in 2025, followed by those in the Russian Federation (13,147), Germany (7,338), Thailand (4,818) and Indonesia (4,756) (figure A56). Among the top 10 origins, Türkiye (+26.6%), Germany (+18.9%) and Thailand (+13.8%) recorded double-digit growth in 2025 compared to 2024, in each case driven primarily by resident filings. In contrast, China (–16.8%), the Russian Federation (–3.3%) and Indonesia (–1.8%) filed fewer applications than in the previous year. Over the recent decade, UM filings from high-income countries, including Germany, Japan and the Republic of Korea, have registered a marked decline. For example, Germany submitted 7,338 UM applications in 2025, down from 11,366 in 2015. In contrast, the volume of UM filings from several middle-income countries has increased substantially. Thailand, for instance, recorded 4,818 filings in 2025, more than double the number submitted in 2015 (2,104).
Beyond the top 20 origins, the Democratic People’s Republic of Korea (643), India (502) and Uzbekistan (491) filed the most UM applications among selected origins in 2025 (figure A57).