
Patent applications worldwide and by region
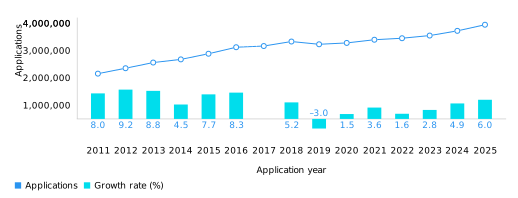 Note: World totals are WIPO estimates using data covering 168 patent offices. Totals include applications filed directly at national and regional offices and applications entering offices through the Patent Cooperation Treaty national phase (where applicable). China’s pre-2017 data are not comparable owing to a change in methodology. Due to this break in the data series, and owing to the large number of filings in China, it is not possible to report an accurate 2017 growth rate at world level (see data description section in Additional information for details).
Source: WIPO Statistics Database, September 2026.
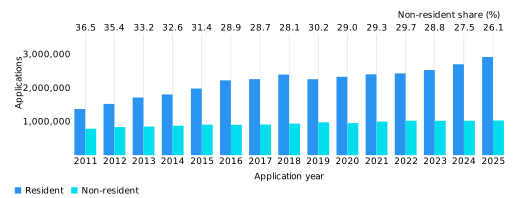 Note: World totals are WIPO estimates using data covering 168 patent offices. Totals include applications filed directly at national and regional offices and applications entering offices through the Patent Cooperation Treaty national phase (where applicable). See glossary for definitions of resident and non-resident.
Source: WIPO Statistics Database, September 2026.

Patent applications by origin
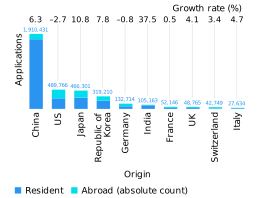
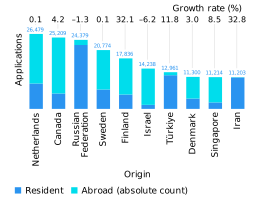 Note: Iran is the Islamic Republic of Iran and Netherlands is the Kingdom of the Netherlands. Patent filing activity by origin includes resident applications and applications filed abroad. The origin of a patent application is determined by the residence of the first named applicant. Origin data are based on absolute counts. For an absolute count, applications filed at regional offices are counted once, rather than being considered equivalent to multiple applications in the respective member states.
Source: WIPO Statistics Database, September 2026.
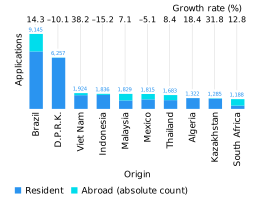
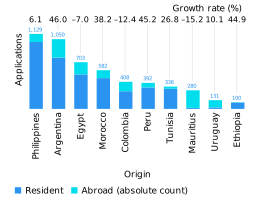 Note: D.P.R.K. is the Democratic People’s Republic of Korea. Patent filing activity by origin includes resident applications and applications filed abroad. The origin of a patent application is determined by the residence of the first named applicant. Origin data are based on absolute counts. For an absolute count, applications filed at regional offices are counted once, rather than being considered equivalent to multiple applications in the respective member states.
Source: WIPO Statistics Database, September 2026.

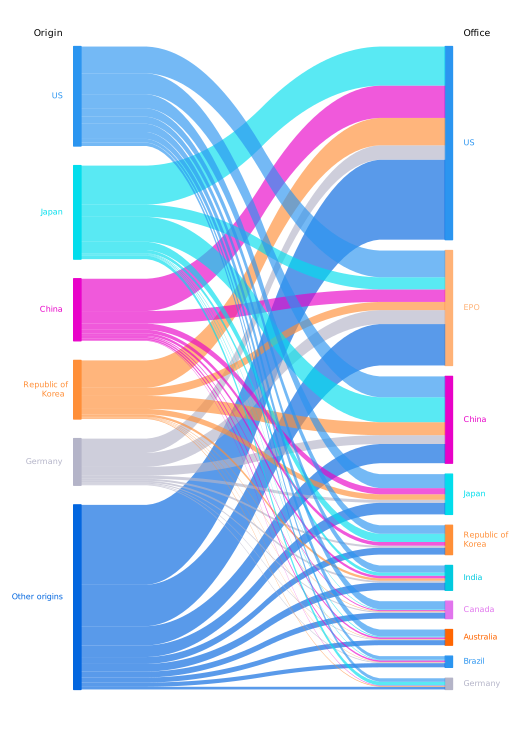 Note: EPO is the European Patent Office. Origin data are based on absolute counts. For an absolute count, applications filed at regional offices are counted once, rather than being considered equivalent to multiple applications in the respective member states.
Source: WIPO Statistics Database, September 2026.
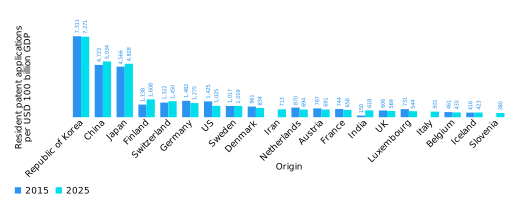 Note: Iran is the Islamic Republic of Iran and Netherlands is the Kingdom of the Netherlands. GDP data are in 2021 US purchasing power parity (PPP) dollars. The top 20 origins were included if they had a GDP greater than USD 25 billion PPP and more than 100 resident patent applications. Because of space constraints, only the top 20 origins fulfilling these criteria are presented.
Sources: WIPO Statistics Database and World Bank, September 2026.
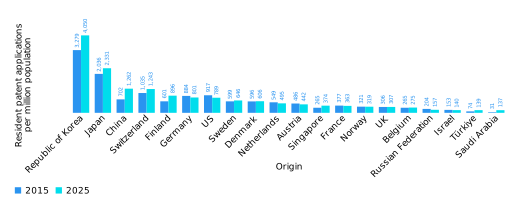 Note: Netherlands is the Kingdom of the Netherlands. The top 20 origins were included if they had a population greater than 5 million and if they had more than 100 resident patent applications. Because of space constraints, only the top 20 origins fulfilling these criteria are presented.
Sources: WIPO Statistics Database and World Bank, September 2026.
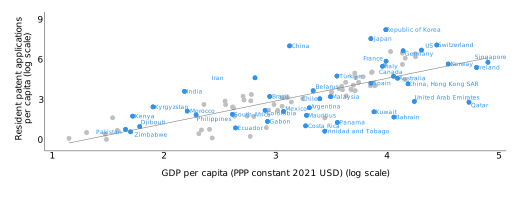 Note: Iran is the Islamic Republic of Iran.
Sources: WIPO Statistics Database and World Bank, September 2026.
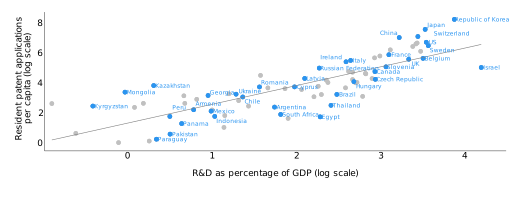 Note: R&D data refer to gross domestic expenditure on research and experimental development (GERD). R&D data lag by one year.
Sources: WIPO Statistics Database, OECD, UNESCO and World Bank, September 2026.
Patent applications by office
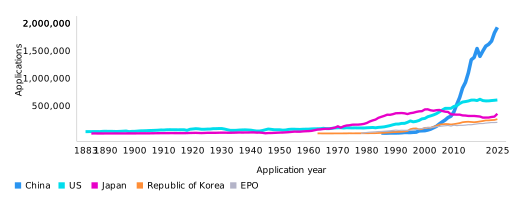 Note: EPO is the European Patent Office. The top five offices were selected based on 2025 totals.
Source: WIPO Statistics Database, September 2026.
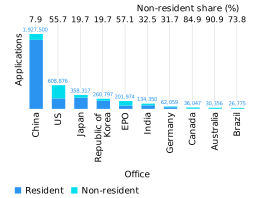
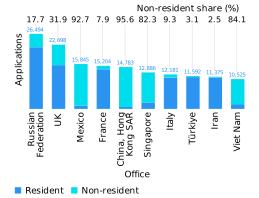 Note: EPO is the European Patent Office. In general, national offices of EPO member states receive smaller volumes of applications, because applicants may apply via the EPO to seek protection within any EPO member state.
Source: WIPO Statistics Database, September 2026.
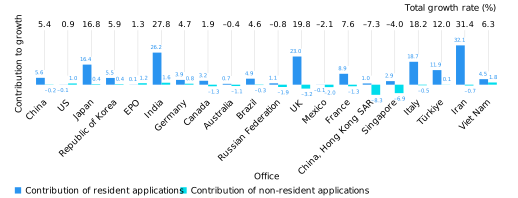 Note: EPO is the European Patent Office and Iran is the Islamic Republic of Iran. This graph shows the total growth or decrease in applications at each office, broken down by the respective contributions of resident and non-resident applications. For example, applications filed at the Japan Patent Office grew by 16.8%. Resident applications accounted for 16.4 percentage points of this increase, while non-resident applications increased by 0.4 percentage points.
Source: WIPO Statistics Database, September 2026.
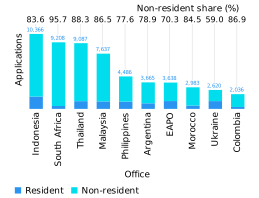
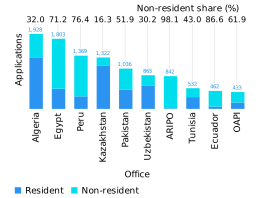 Note: ARIPO is the African Regional Intellectual Property Organization, EAPO is the Eurasian Patent Organization and OAPI is the African Intellectual Property Organization. The selected offices are from different world regions. Where available, data for all offices are presented in statistical table A62.
Source: WIPO Statistics Database, September 2026.
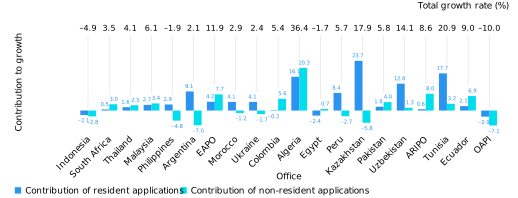 Note: ARIPO is the African Regional Intellectual Property Organization, EAPO is the Eurasian Patent Organization and OAPI is the African Intellectual Property Organization. The selected offices are from different world regions. This graph shows the total growth or decrease in applications at each office, broken down by the respective contributions of resident and non-resident applications. For example, applications filed at the IP office of South Africa grew by 3.5%. Resident applications accounted for 0.5 percentage points of this increase, while non-resident applications increased by 3.0 percentage points.
Source: WIPO Statistics Database, September 2026.
Published patent applications by field of technology

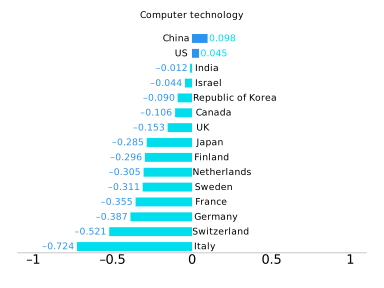
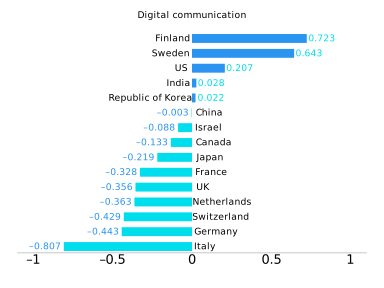
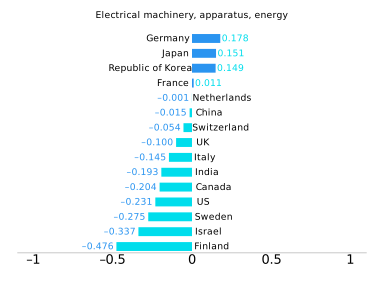
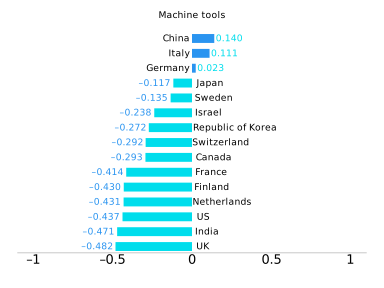
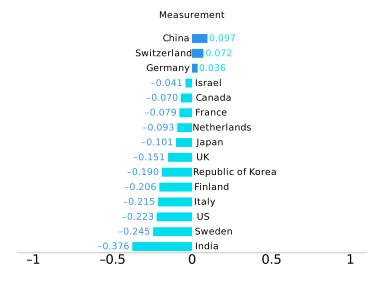
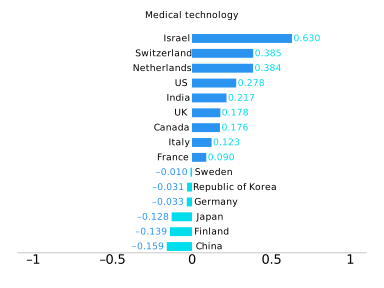
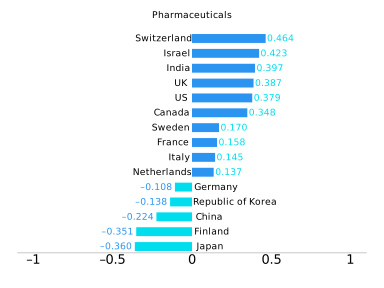
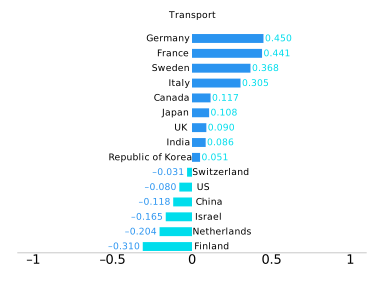 Note: Netherlands is the Kingdom of the Netherlands. Data refer to published patent applications. There is a minimum 18-month delay between application date and publication date. WIPO’s International Patent Classification (IPC) technology concordance table was used to convert IPC symbols into 35 corresponding fields of technology. For an electronic version of the IPC technology concordance table, visit www.wipo.int/en/web/ipstatistics. The top 15 origins were selected based on 2022–2024 total published applications. A positive relative specialization index value for a technology indicates that a country has a relatively high share of patent filings related to that technology field.
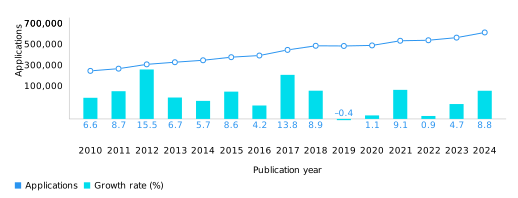 Note: Data refer to published patent applications. There is a minimum 18-month delay between application date and publication date. WIPO’s International Patent Classification (IPC)-Green technology concordance table was used to convert IPC symbols into corresponding fields of green technology. For an electronic version of the IPC-Green technology concordance table, visit www.wipo.int/en/web/ip-statistics.
Sources: WIPO Statistics Database and EPO PATSTAT database, September 2026.

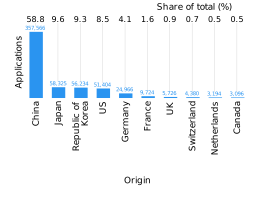
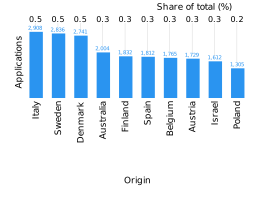 Note: Netherlands is the Kingdom of the Netherlands. Data refer to published patent applications. There is a minimum 18-month delay between application date and publication date. The top 20 origins were selected based on total number of published green technology applications in 2024. WIPO’s International Patent Classification (IPC)-Green technology concordance table was used to convert IPC symbols into corresponding fields of green technology. For an electronic version of the IPC-Green technology concordance table, visit www.wipo.int/en/web/ip-statistics.
Sources: WIPO Statistics Database and EPO PATSTAT database, September 2026.
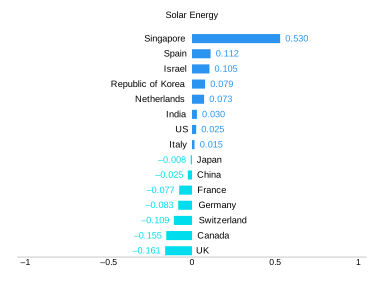
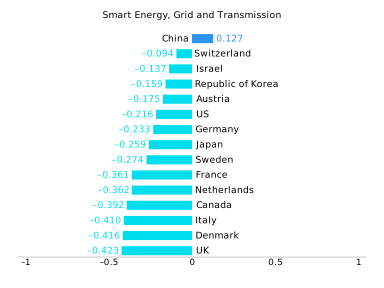
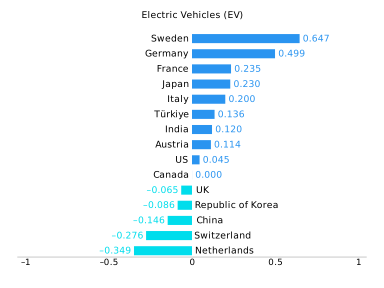
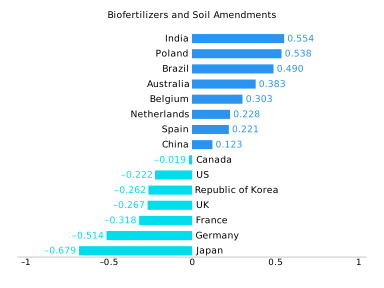
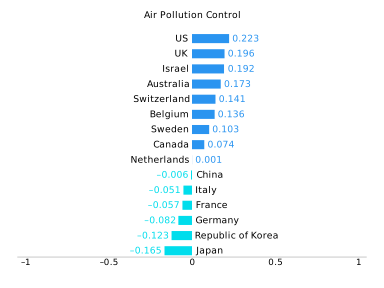
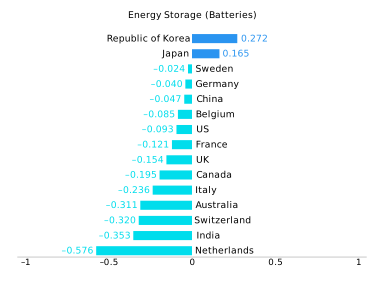 Note: Netherlands is the Kingdom of the Netherlands. Data refer to published patent applications. There is a minimum 18-month delay between application date and publication date. The top 15 origins were selected based on number of published patent applications over the 2022–2024 period. WIPO’s International Patent Classification (IPC)-Green technology concordance table was used to convert IPC symbols into corresponding fields of green technology. For an electronic version of the IPC-Green technology concordance table, visit www.wipo.int/en/web/ip-statistics.
Sources: WIPO Statistics Database and EPO PATSTAT database, September 2026.
Participation of women inventors in published PCT applications
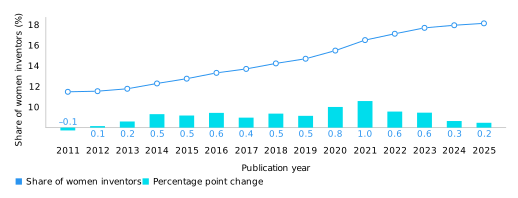 Note: Data refer to published PCT applications. In order to attribute gender to inventors’ names recorded in PCT applications, WIPO produced a world gender–name dictionary based on information from 13 different public sources. Gender is attributed to a given name on a country-by-country basis, because certain names may be considered male in one country but female in another.
Source: WIPO Statistics Database, September 2026.
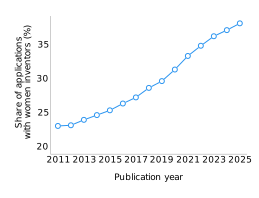
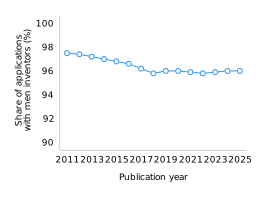 Note: Data refer to published PCT applications. In order to attribute gender to inventors’ names recorded in PCT applications, WIPO produced a gender–name dictionary based on information from 13 different public sources. Gender is attributed to a given name on a country-by-country basis, because certain names may be considered male in one country but female in another.
Source: WIPO Statistics Database, September 2026.
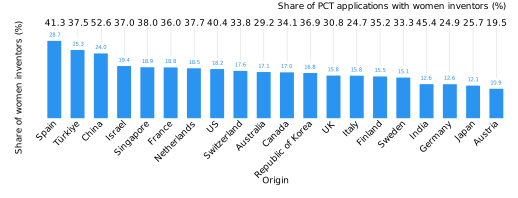 Note: Netherlands is the Kingdom of the Netherlands. Data refer to published PCT applications. In order to attribute gender to inventors’ names recorded in PCT applications, WIPO produced a gender–name dictionary based on information from 13 different public sources. Gender is attributed to a given name on a country-by-country basis, because certain names may be considered male in one country but female in another.
Source: WIPO Statistics Database, September 2026.
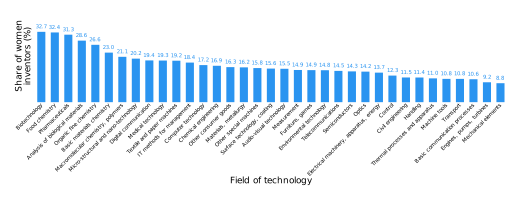 Note: Data refer to published PCT applications. WIPO’s International Patent Classification (IPC) technology concordance table was used to convert IPC symbols into 35 corresponding fields of technology. For an electronic version of the IPC technology concordance table, visit www.wipo.int/en/web/ip-statistics.
Source: WIPO Statistics Database, September 2026.
Patent families
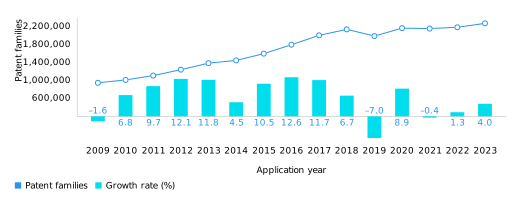 Note: Applicants often file patent applications in multiple jurisdictions therefore some inventions are recorded more than once. To take this into account, WIPO has indicators related to patent families, defined as patent applications interlinked by one or more of the following: priority claim, Patent Cooperation Treaty national phase entry, continuation, continuation-in-part, internal priority, and addition or division. Patent families here include only those families associated with patent applications for inventions and exclude those associated with utility model applications.
Sources: WIPO Statistics Database and EPO PATSTAT database, September 2026.
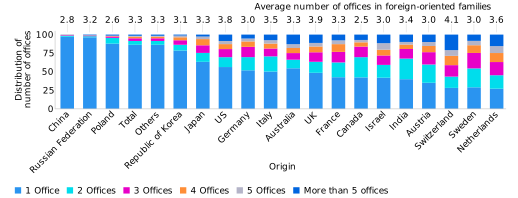 Note: Netherlands is the Kingdom of the Netherlands. A patent family is defined as patent applications interlinked by one or more of the following: priority claim, Patent Cooperation Treaty national phase entry, continuation, continuation-in-part, internal priority, and addition or division. Patent families here include only those families associated with patent applications for inventions and exclude those associated with utility model applications.
Sources: WIPO Statistics Database and EPO PATSTAT database, September 2026.
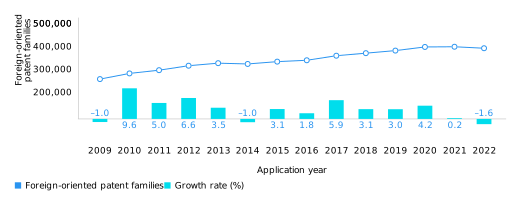 Note: A special subset of patent families comprises foreign-oriented patent families. This includes only those patent families that have at least one filing office different from the office of the applicant’s country of origin. Some foreign-oriented patent families include only one filing office, because applicants may choose to file directly with a foreign office. For example, if a Canadian applicant files a patent application directly with the United States Patent and Trademark Office (USPTO) without having previously filed with the patent office of Canada, that application and any applications filed subsequently with the USPTO will form a foreign-oriented patent family.
Sources: WIPO Statistics Database and EPO PATSTAT database, September 2026.
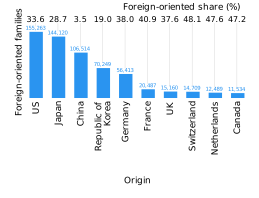
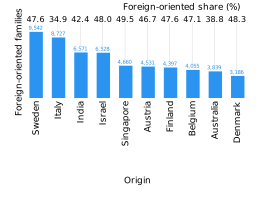 Note: Netherlands is the Kingdom of the Netherlands. A special subset of patent families comprises foreign-oriented patent families. This includes only those patent families that have at least one filing office different from the office of the applicant’s country of origin. Some foreign-oriented patent families include only one filing office, because applicants may choose to file directly with a foreign office. For example, if a Canadian applicant files a patent application directly with the United States Patent and Trademark Office (USPTO) without having previously filed with the patent office of Canada, that application and any applications filed subsequently with the USPTO will form a foreign-oriented patent family.
Sources: WIPO Statistics Database and EPO PATSTAT database, September 2026.
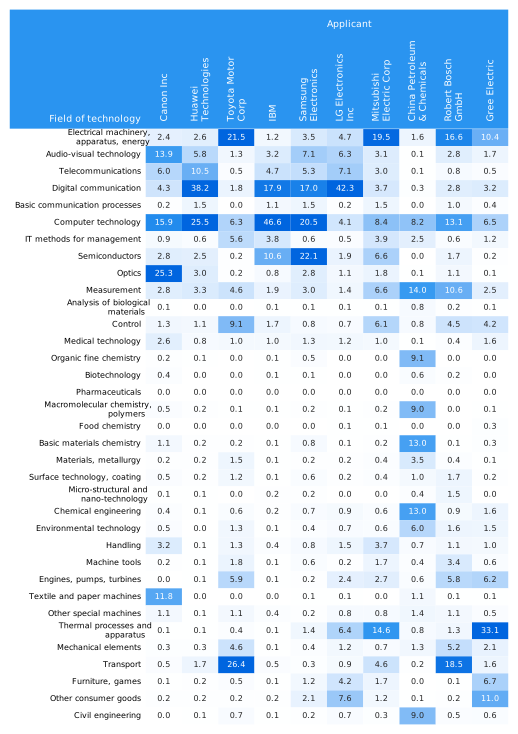 Note: WIPO’s International Patent Classification (IPC) technology concordance table was used to convert IPC symbols into 35 corresponding fields of technology. For an electronic version of the IPC technology concordance table, visit www.wipo.int/en/web/ip-statistics.
Sources: WIPO Statistics Database and EPO PATSTAT database, September 2026.
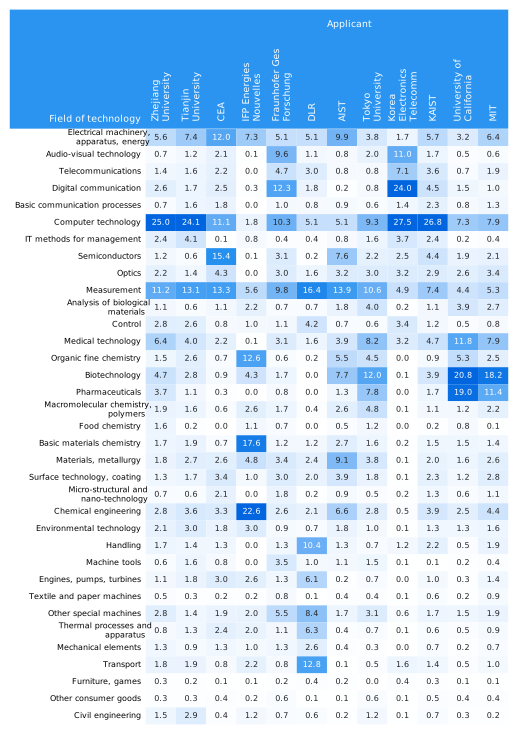 Note: PRO means public research organization. A patent family is defined as patent applications interlinked by one or more of the following: priority claim, Patent Cooperation Treaty national phase entry, continuation, continuation-in-part, internal priority, and addition or division. Patent families include only those families associated with patent applications for inventions and exclude any associated with utility model applications. National Institute of Advanced Industrial Science and Technology (AIST); Le Commissariat à l’énergie atomique et aux énergies alternatives (CEA); Deutsches Zentrum für Luft- und Raumfahrt E.V. (DLR); Korea Advanced Institute of Science and Technology (KAIST) and Massachusetts Institute of Technology (MIT).
Sources: WIPO Statistics Database and EPO PATSTAT database, September 2026.
Patent grants worldwide and by region
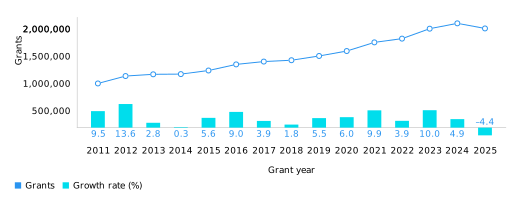 Note: World totals are WIPO estimates using data covering 158 patent offices. Totals include patent grants based on applications filed directly at national and regional offices and patents granted by offices on the basis of the Patent Cooperation Treaty national phase (where applicable).
Source: WIPO Statistics Database, September 2026.
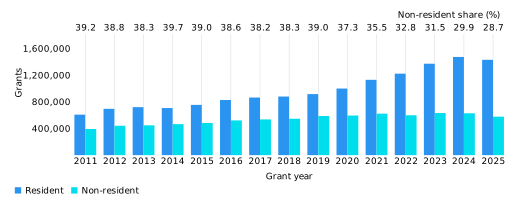 Note: World totals are WIPO estimates using data covering 158 patent offices. Totals include patent grants based on applications filed directly at national and regional offices and patents granted by offices on the basis of the Patent Cooperation Treaty national phase (where applicable). See glossary for definitions of resident and non-resident.
Source: WIPO Statistics Database, September 2026.

Patent grants by origin
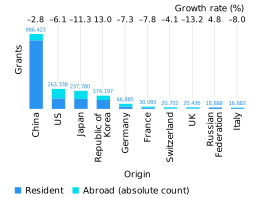
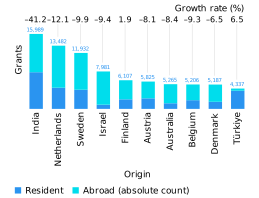 Note: Netherlands is the Kingdom of the Netherlands. Origin data are based on absolute counts. For an absolute count, patent grants issued by regional offices are counted once, rather than being considered equivalent to multiple grants in the respective member states.
Source: WIPO Statistics Database, September 2026.
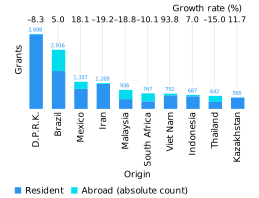
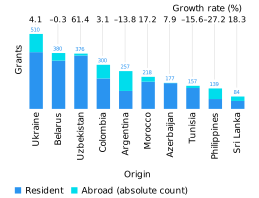 Note: D.P.R.K. is the Democratic People’s Republic of Korea and Iran is the Islamic Republic of Iran. Origin data are based on absolute counts. For an absolute count, patent grants issued by regional offices are counted once, rather than being considered equivalent to multiple grants in the respective member states.
Source: WIPO Statistics Database, September 2026.
Patent grants by office
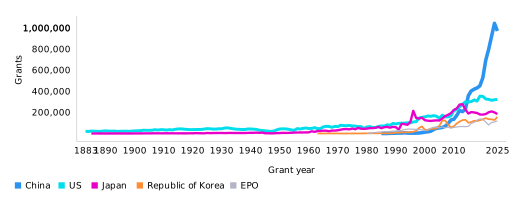 Note: EPO is the European Patent Office. The top five offices were selected based on 2025 totals.
Source: WIPO Statistics Database, September 2026.
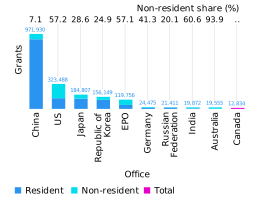
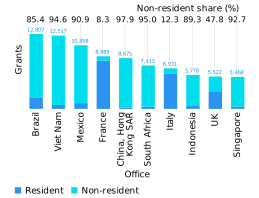 Note: EPO is the European Patent Office. The procedure for issuing patents varies between offices, and differences in the number of patents granted among offices depend on factors such as examination capacity and procedural delays. The examination process can take a long time therefore there is invariably a time lag between application and grant dates. For this reason, data on applications for a given year should not be compared with data on grants for that same year.
Source: WIPO Statistics Database, September 2026.
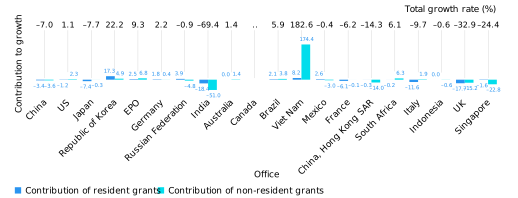 Note: EPO is the European Patent Office. This graph shows the total growth or decrease in grants at each office, broken down by the respective contributions of resident and non-resident grants. For example, the total number of patents granted by the Republic of Korea grew by 22.2%. Resident grants accounted for 17.3 percentage points of this increase, while the remaining 4.9 percentage points came from a growth in non-resident grants. .. indicates not available.
Source: WIPO Statistics Database, September 2026.
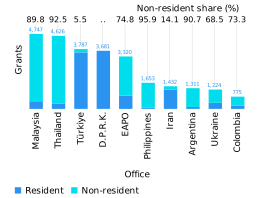
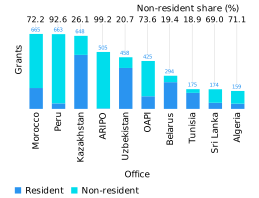 Note: ARIPO is the African Regional Intellectual Property Organization, D.P.R.K. is the Democratic People’s Republic of Korea, EAPO is the Eurasian Patent Organization, Iran is the Islamic Republic of Iran and OAPI is the African Intellectual Property Organization. The selected offices are from different world regions. Where available, data for all offices are presented in statistical table A63. .. indicates not available.
Source: WIPO Statistics Database, September 2026.
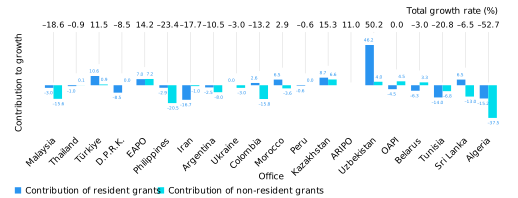 Note: ARIPO is the African Regional Intellectual Property Organization, D.P.R.K. is the Democratic People’s Republic of Korea, EAPO is the Eurasian Patent Organization, Iran is the Islamic Republic of Iran and OAPI is the African Intellectual Property Organization. This graph shows the total growth or decrease in grants at each office, broken down by the respective contributions of resident and non-resident grants. For example, the total number of patents granted by the IP office of Türkiye grew by 11.5%. Resident grants accounted for 10.6 percentage point of this increase, while the remaining 0.9 percentage points came from a growth in non-resident grants. A resident versus non-resident breakdown is unavailable for ARIPO.
Source: WIPO Statistics Database, September 2026.
Patents in force
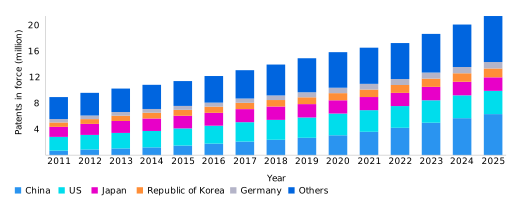 Note: World totals are WIPO estimates using data covering 142 offices.
Source: WIPO Statistics Database, September 2026.
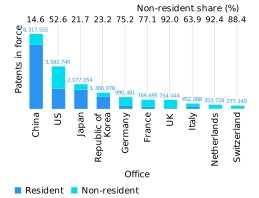
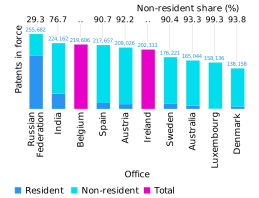 Note: Netherlands is the Kingdom of the Netherlands. .. indicates not available.
Source: WIPO Statistics Database, September 2026.
 Note: Netherlands is the Kingdom of the Netherlands.
Source: WIPO Statistics Database, September 2026.
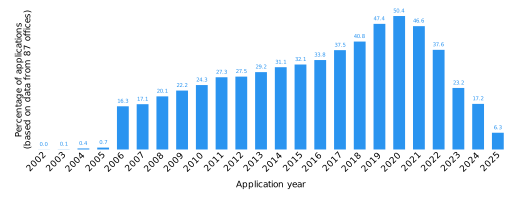 Note: Percentages are calculated as the number of patent applications filed in year t and in force in 2025, divided by the total number of patent applications filed in year t. Patent holders must pay maintenance fees to maintain the validity of their patents. Depending on technological and commercial considerations, patent holders may opt to let a patent lapse before the end of the full protection term. This graph shows the distribution of patents in force in 2025 as a percentage of total applications in the year of filing. However, not all offices provide such data. Data for 87 offices show that 33.8% of the applications for which patents were eventually granted remained in force for at least 10 years after the application date, and about 16.3% lasted the full 20-year term.
Source: WIPO Statistics Database, September 2026.
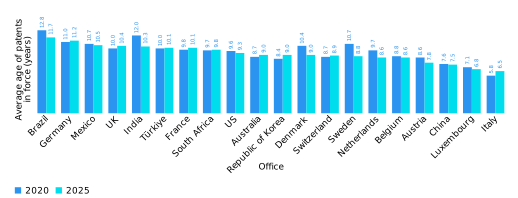 Note: Netherlands is the Kingdom of the Netherlands. The average age of patents in force is calculated using the following formula: Σ(p*y)/Σp, where p is the number of patents in force and y the number of years between filing and reporting year.
Source: WIPO Statistics Database, September 2026.
Patent office procedural data
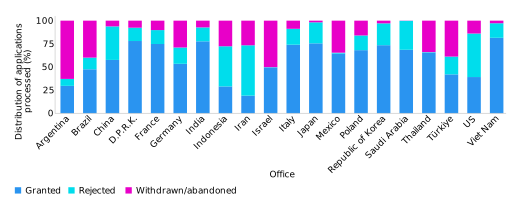 Note: D.P.R.K. is the Democratic People’s Republic of Korea and Iran is the Islamic Republic of Iran. Data for the European Patent Office – one of the five leading offices in terms of applications received – is not included in this graph, because figures for rejected and withdrawn/abandoned applications are not available. The share of applications granted should not be interpreted as a grant rate, as it is based on the examination date rather than the date when the application was filed. The number of grants in a given year relates to applications filed in previous years. WIPO collects data from IP offices using a common questionnaire and methodology. However, because of procedural differences between patent offices, data cannot be fully harmonized. Therefore, caution should be exercised when making comparisons across offices.
Source: WIPO Statistics Database, September 2026.
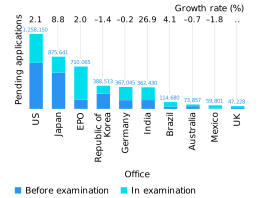
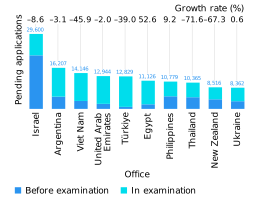 Note: EPO is the European Patent Office. Data for China in 2025 – the largest IP office in terms of applications received – is not included in this graph, as only partial information is available. That office reported 744,738 applications under examination, which would place it as the third largest in terms of pending applications. Application processing varies between offices, making it difficult to measure pending applications. At some offices, a patent application automatically proceeds to the examination stage, unless withdrawn by the applicant; in others, an application does not proceed to examination, unless the applicant files a separate request for examination. To take account of procedural differences, pending application data are separated between (a) all patent applications, at any stage in the process, that are awaiting a final decision by a patent office, including those for which applicants have not filed a request for examination (where applicable), and (b) patent applications undergoing examination for which the applicant has requested examination (where such a request is necessary). .. Indicates not available.
Source: WIPO Statistics Database, September 2026.
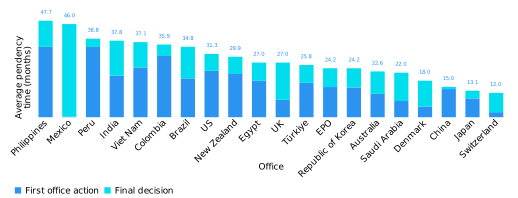 Note: EPO is the European Patent Office. WIPO collects data from IP offices using a common questionnaire and methodology. However, because of procedural differences between patent offices, data cannot be fully harmonized. Therefore, caution should be exercised when making comparisons across offices.
Source: WIPO Statistics Database, September 2026.
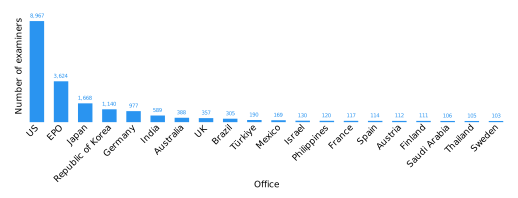 Note: EPO is the European Patent Office. The number of patent examiners at the IP office of China – the largest office in terms of applications received – are not available for 2025.
Source: WIPO Statistics Database, September 2026.
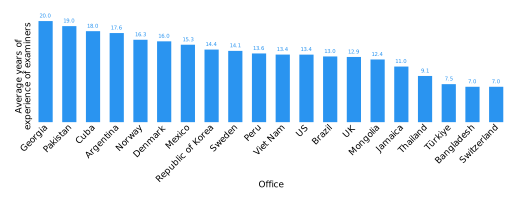
Source: WIPO Statistics Database, September 2026.
Patent prosecution highway (PPH)

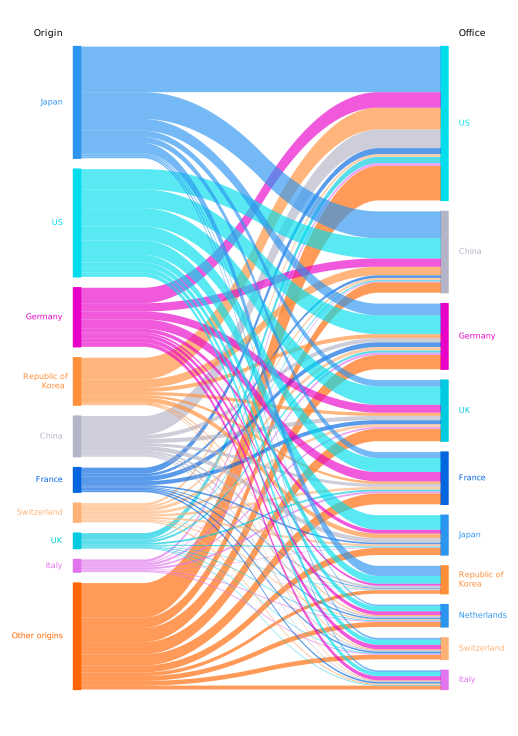
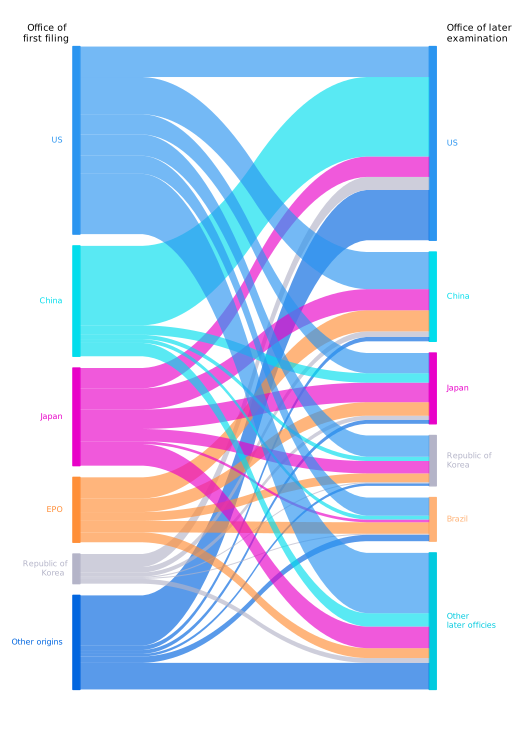 Note: EPO is the European Patent Office. Japan data refers to the office of earlier examination rather than the office of first filing. A patent prosecution highway (PPH) is a bilateral agreement between two offices enabling applicants to request a fast-track examination whereby patent examiners can utilize work already undertaken by the other office. This graph shows the flows of PPH requests between offices of first filing and offices of later examination.
Source: WIPO Statistics Database, September 2026.
Utility model applications
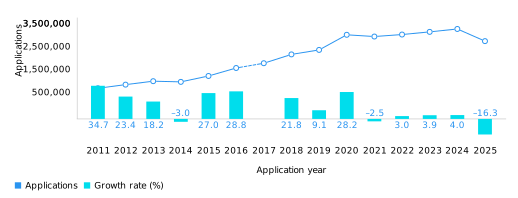 Note: World totals are WIPO estimates using data covering 89 patent offices. Totals include applications filed directly at national and regional offices and applications entering offices through the Patent Cooperation Treaty national phase (where applicable). China’s pre-2017 data are not comparable owing to a change in methodology. Due to this break in the data series, and owing to the large number of filings in China, it is not possible to report accurately the 2017 growth rate at world level (see data description section in Additional information for details).
Source: WIPO Statistics Database, September 2026.
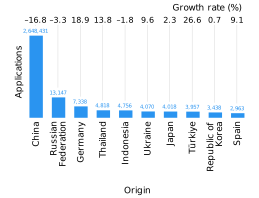
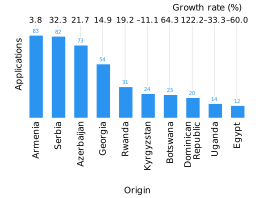
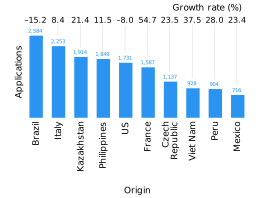 Note: The origin of a utility model (UM) application is determined by the residence of the first named applicant. Although the US does not have a utility model system of its own, applicants residing in the US filed 1,731 UM applications abroad in 2025, in jurisdictions such as China and Germany.
Source: WIPO Statistics Database, September 2026.
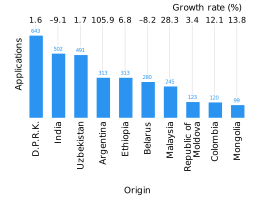
 Note: D.P.R.K. is the Democratic People’s Republic of Korea. The origin of a utility model (UM) application is determined by the residence of the first named applicant. Although India does not have a utility model system of its own, applicants residing in India filed 502 UM applications abroad in 2025, in jurisdictions such as China and Germany.
Source: WIPO Statistics Database, September 2026.
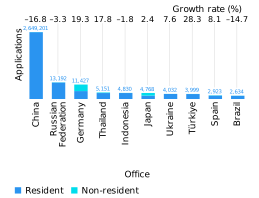
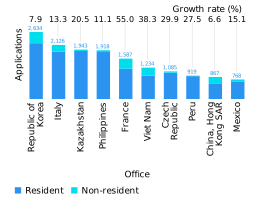
Source: WIPO Statistics Database, September 2026.
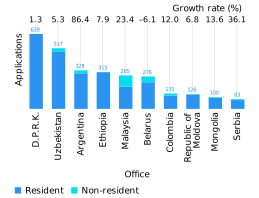
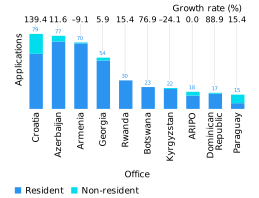 Note: ARIPO is the African Regional Intellectual Property Organization and D.P.R.K. is the Democratic People’s Republic of Korea.
Source: WIPO Statistics Database, September 2026.
Microorganisms
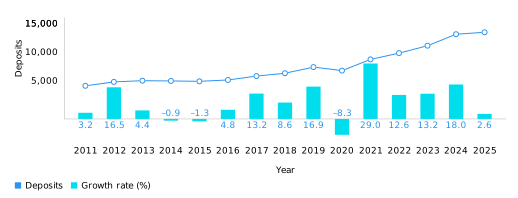 Note: Deposits of microorganisms for patent procedures are important for biotechnological inventions. Disclosing an invention is a requirement for receiving a patent.
Source: WIPO Statistics Database, September 2026.
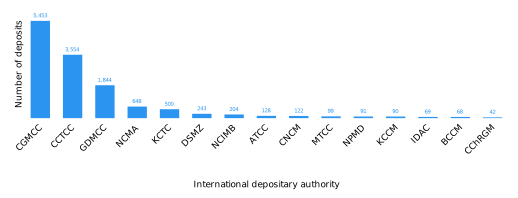 Note: ATCC is the American Type Culture Collection (US), BCCM is the Belgian Coordinated Collections of Microorganisms (Belgium), CChRGM is the Colección Chilena de Recursos Genéticos Microbianos (Chile), CCTCC is the China Center for Type Culture Collection (China), CGMCC is the China General Microbiological Culture Collection Center (China), CNCM is the Collection Nationale de Cultures de Microorganismes (France), DSMZ is the Leibniz-Institut DSMZ (Deutsche Sammlung von Mikroorganismen und Zellkulturen GmbH) (Germany), GDMCC is the Guangdong Microbial Culture Collection Center (China), IDAC is the International Depositary Authority of Canada (Canada), KCCM is the Korean Culture Center of Microorganisms (Republic of Korea), KCTC is the Korean Collection for Type Cultures (Republic of Korea), MTCC is the Microbial Type Culture Collection and Gene Bank (India), NCIMB is the National Collection of Industrial Food and Marine Bacteria (UK), NCMA is the Provasoli-Guillard National Center for Marine Algae and Microbiota (US) and NPMD is the National Institute of Technology and Evaluation, Patent Microorganisms Depositary (Japan).
Source: WIPO Statistics Database, September 2026.
Statistical tables


