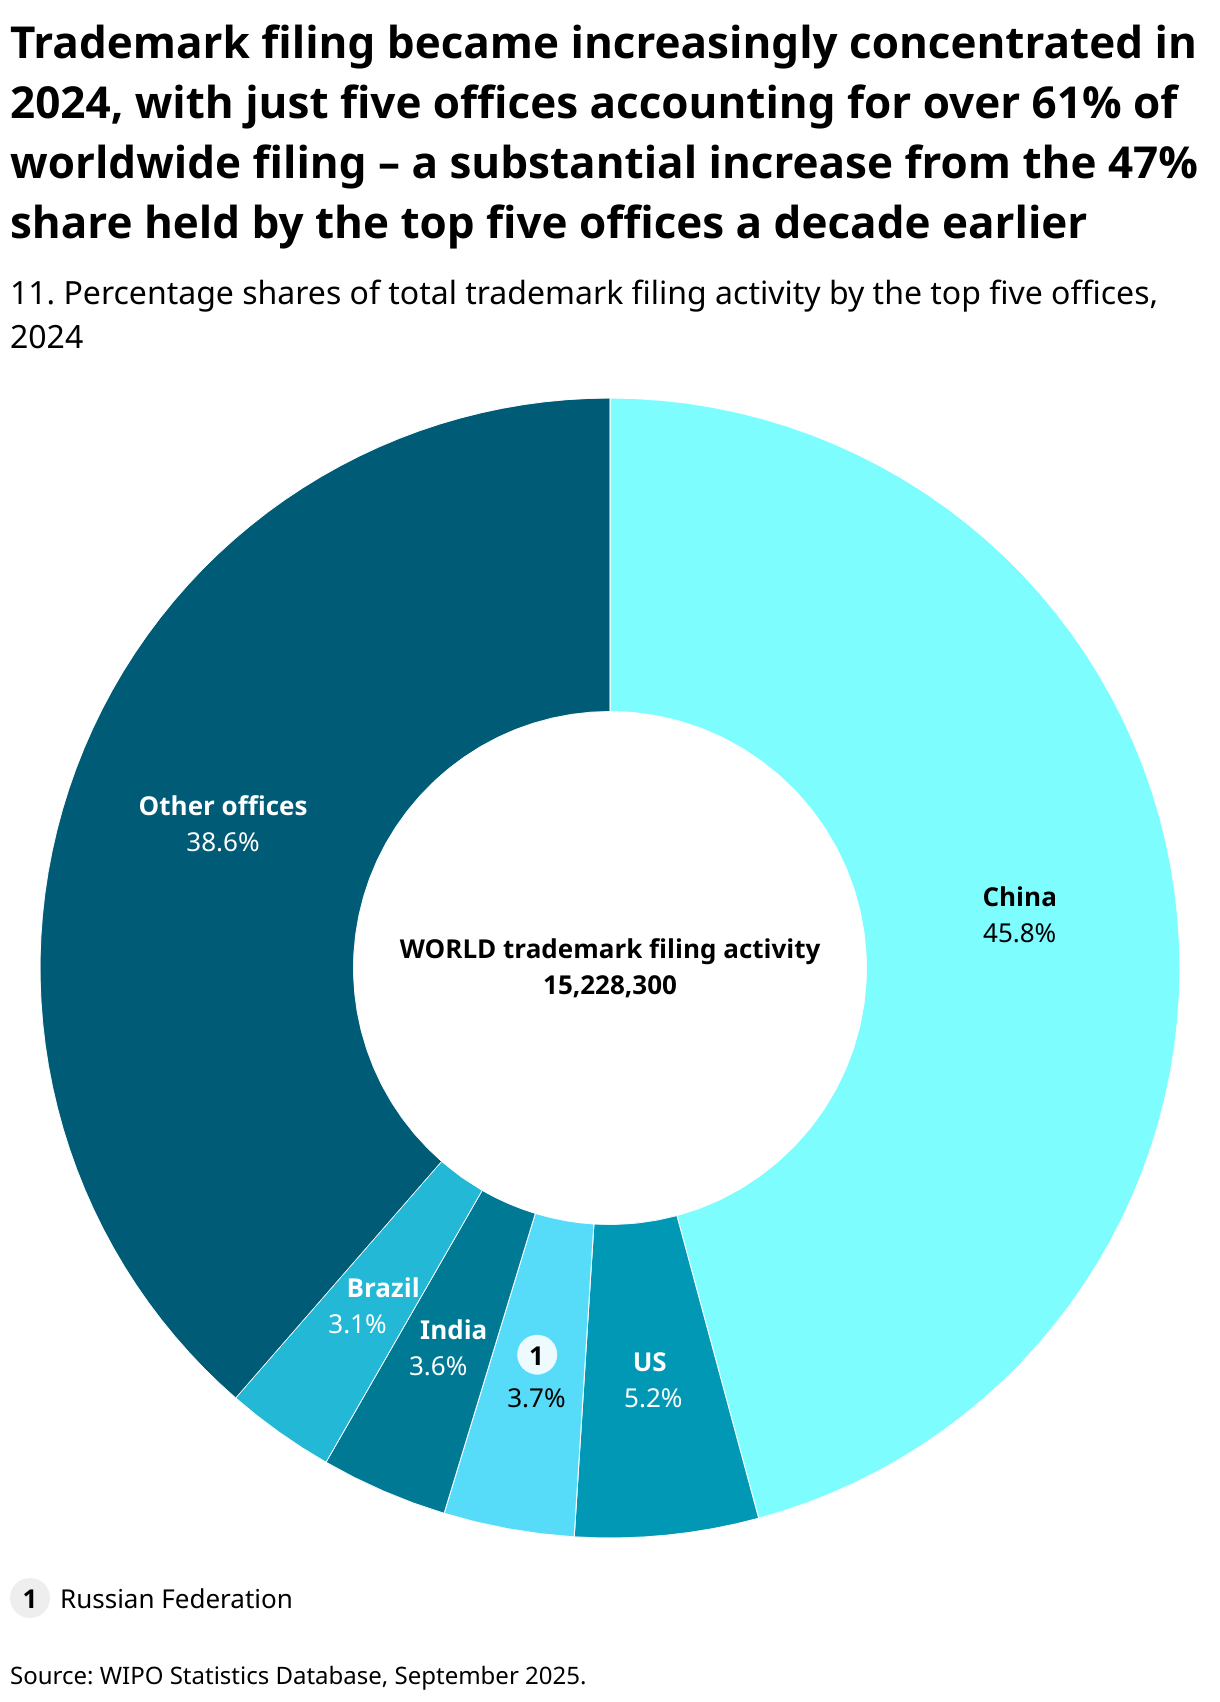
Trademark filing in 2024 remained heavily concentrated in a handful of jurisdictions. The top five offices collectively received over 61% of all filing – as measured by class counts – with China accounting for nearly half (45.8%), the vast majority being from Chinese residents. Each of the other four top offices received between 3% and approximately 5% of worldwide filing.
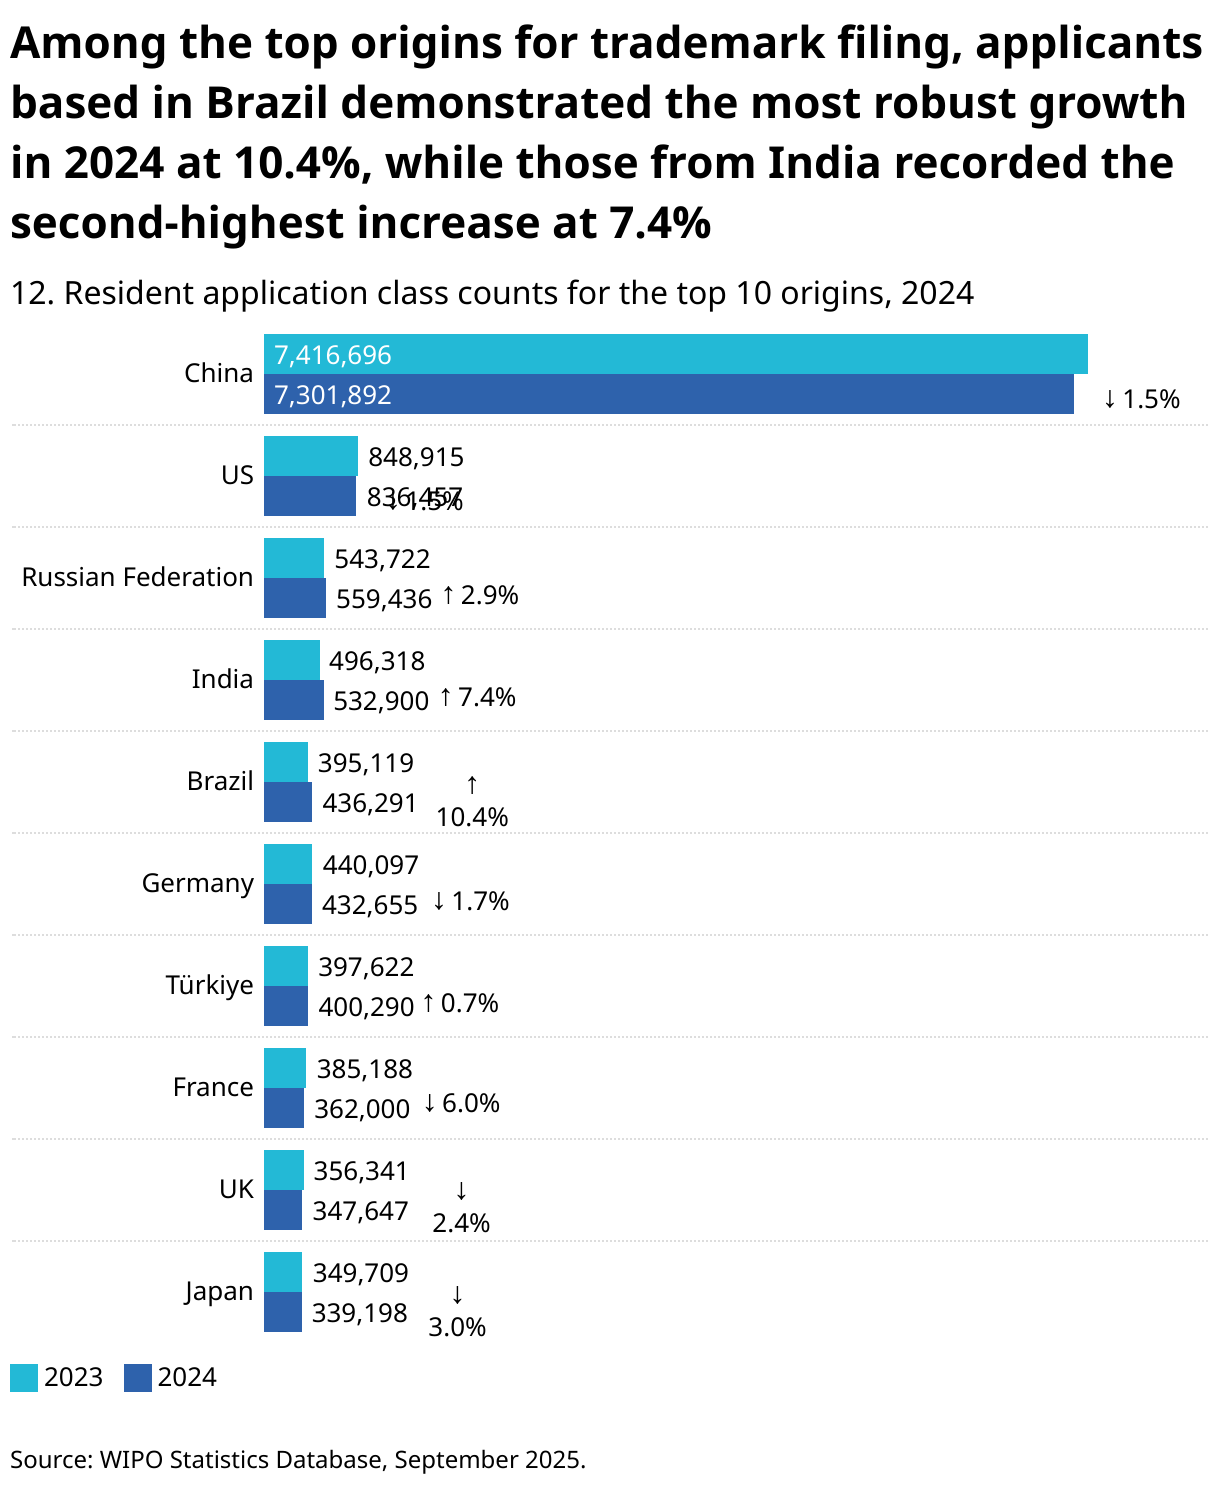
By origin, China-based applicants dominated global trademark filing with a combined domestic and abroad application class count of around 7.3 million. US-based applicants ranked a distant second at 836,457, followed by applicants based in the Russian Federation (559,436), India (532,900) and Brazil (436,291).
Filing trends among the top five origins showed mixed results. Brazil demonstrated the strongest growth at 10.4%, driven by increases in both resident and abroad filing. India followed with 7.4% growth, while the Russian Federation posted a more modest increase of 2.9%. However, both India and the Russian Federation’s growth came entirely from domestic filing, as abroad filing for applicants of these two origins declined.
In contrast, applicants from the two largest countries of origin experienced contractions in 2024. China's overall filing declined 1.5% – despite a substantial 20.5% increase in abroad filing – due to a reduction in resident filing. Conversely, the US saw a similar 1.5% overall decrease, but in this case a 3.4% growth in resident filing was offset by a 7.7% drop in abroad filing.

Middle-income countries demonstrated significant trademark filing activity in 2024, with nine appearing among the top 20 origins. In addition to China, Brazil, India and Türkiye, they included the Islamic Republic of Iran with an application class count of 304,854, followed by Mexico (170,622), Indonesia (131,014), Viet Nam (91,600) and Argentina (89,116). Pakistan (52,582), the Philippines (39,260) and Colombia (38,838) also recorded notably high filing volumes. Among the 10 origins selected from within the middle-income group, growth patterns varied considerably: filing by applicants based in Argentina and Pakistan surged with increases of 19.7% and 17% respectively, while filing by applicants based in the Islamic Republic of Iran decreased by 5.2%.
A common characteristic among several middle-income origins was their domestic focus – applicants based in Indonesia (2.4%), the Islamic Republic of Iran (0.9%), Morocco (5.2%), Pakistan (3%) and the Philippines (2.7%) directed only 5% or less of their filing abroad, concentrating instead on brand protection at home. For the trademark application class counts for every origin (where available), see statistical table 1.
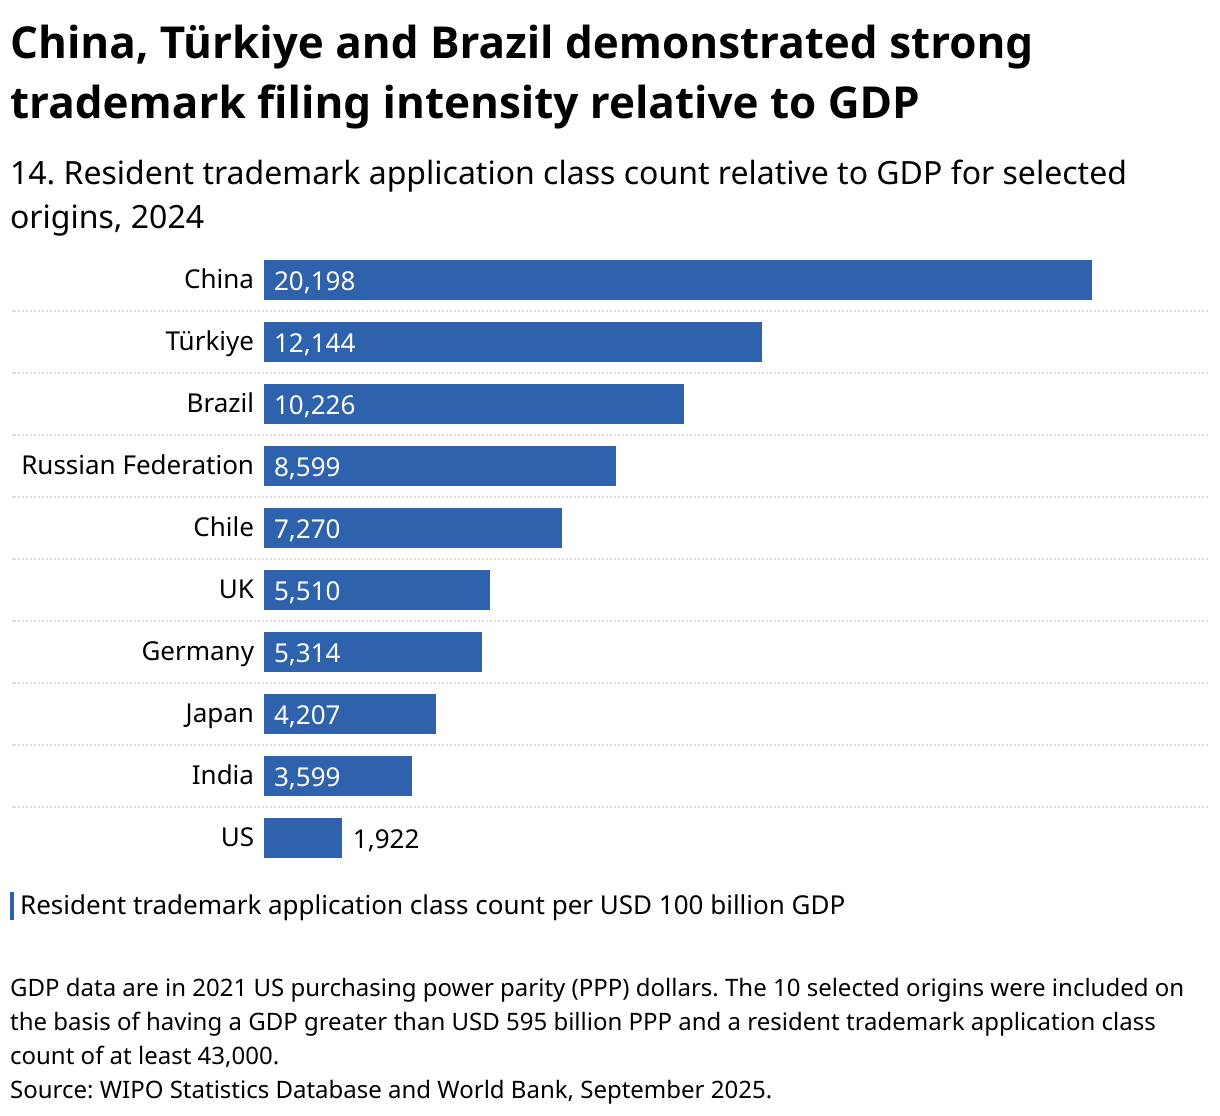
Calculating application class count per unit of USD 100 billion GDP allows a comparison to be made between trademark filing in countries with different filing systems (single-class versus multi-class) and economies of varying sizes. On this measure, smaller countries, such as Brazil and Türkiye, rank higher than some larger ones with higher class counts in absolute terms, such as India and the US.
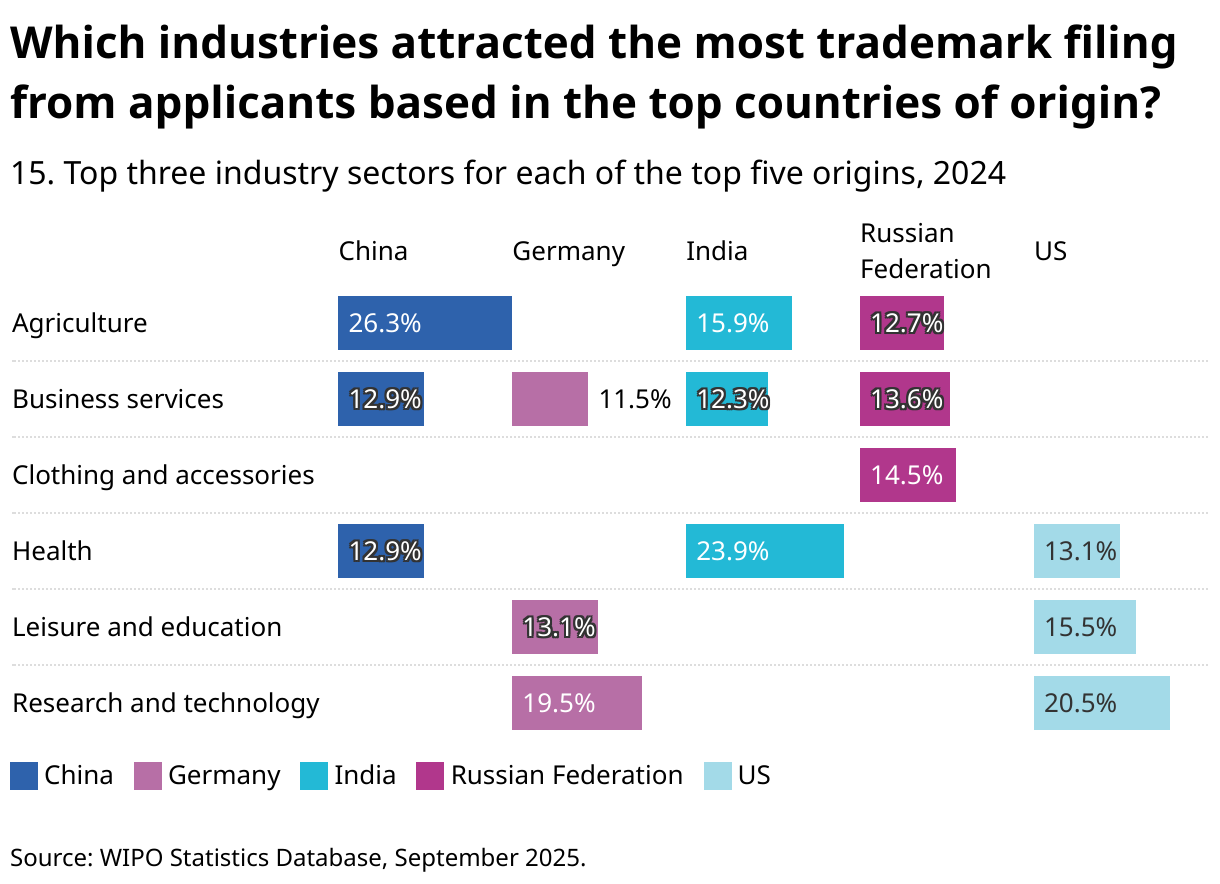
Using the Nice Classification, trademark applications can be categorized into 10 industry sectors. Figure 15 identifies the top three industry sectors for applicants based in the five countries of origin with the highest trademark filing volumes in 2024. Agriculture, business services and health emerged as the three leading sectors for applications originating from China and India. Agriculture ranked first for China-based applicants, while health led for those in India. Research and technology, along with leisure and education were the top two industry sectors for applicants based in Germany and the US. Applicants based in the Russian Federation most frequently sought trademark protection in the clothing industry.