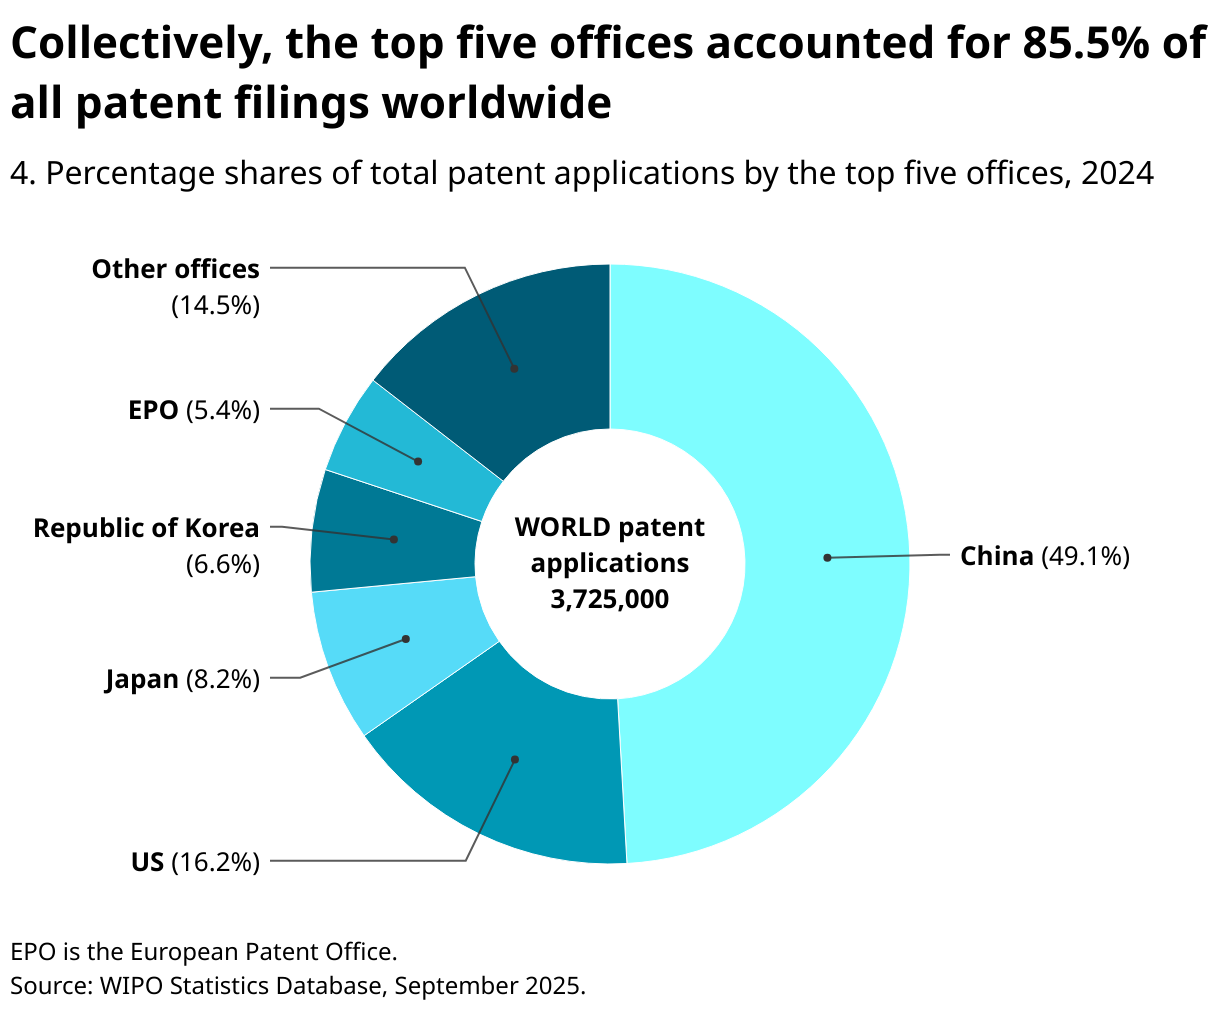
The top five offices held a combined share of 85.5% of all patent applications filed worldwide in 2024, up 3.5 percentage points from a decade earlier in 2014. This increase stems entirely from China's remarkable growth. Its share of applications has jumped from 34.6% in 2014 to 49.1% in 2024 – nearly half of all global filings. As a result, every other top five office has seen its share decrease over the same period. That of the US, for example, has fallen from 21.6% to 16.2% over the past decade.
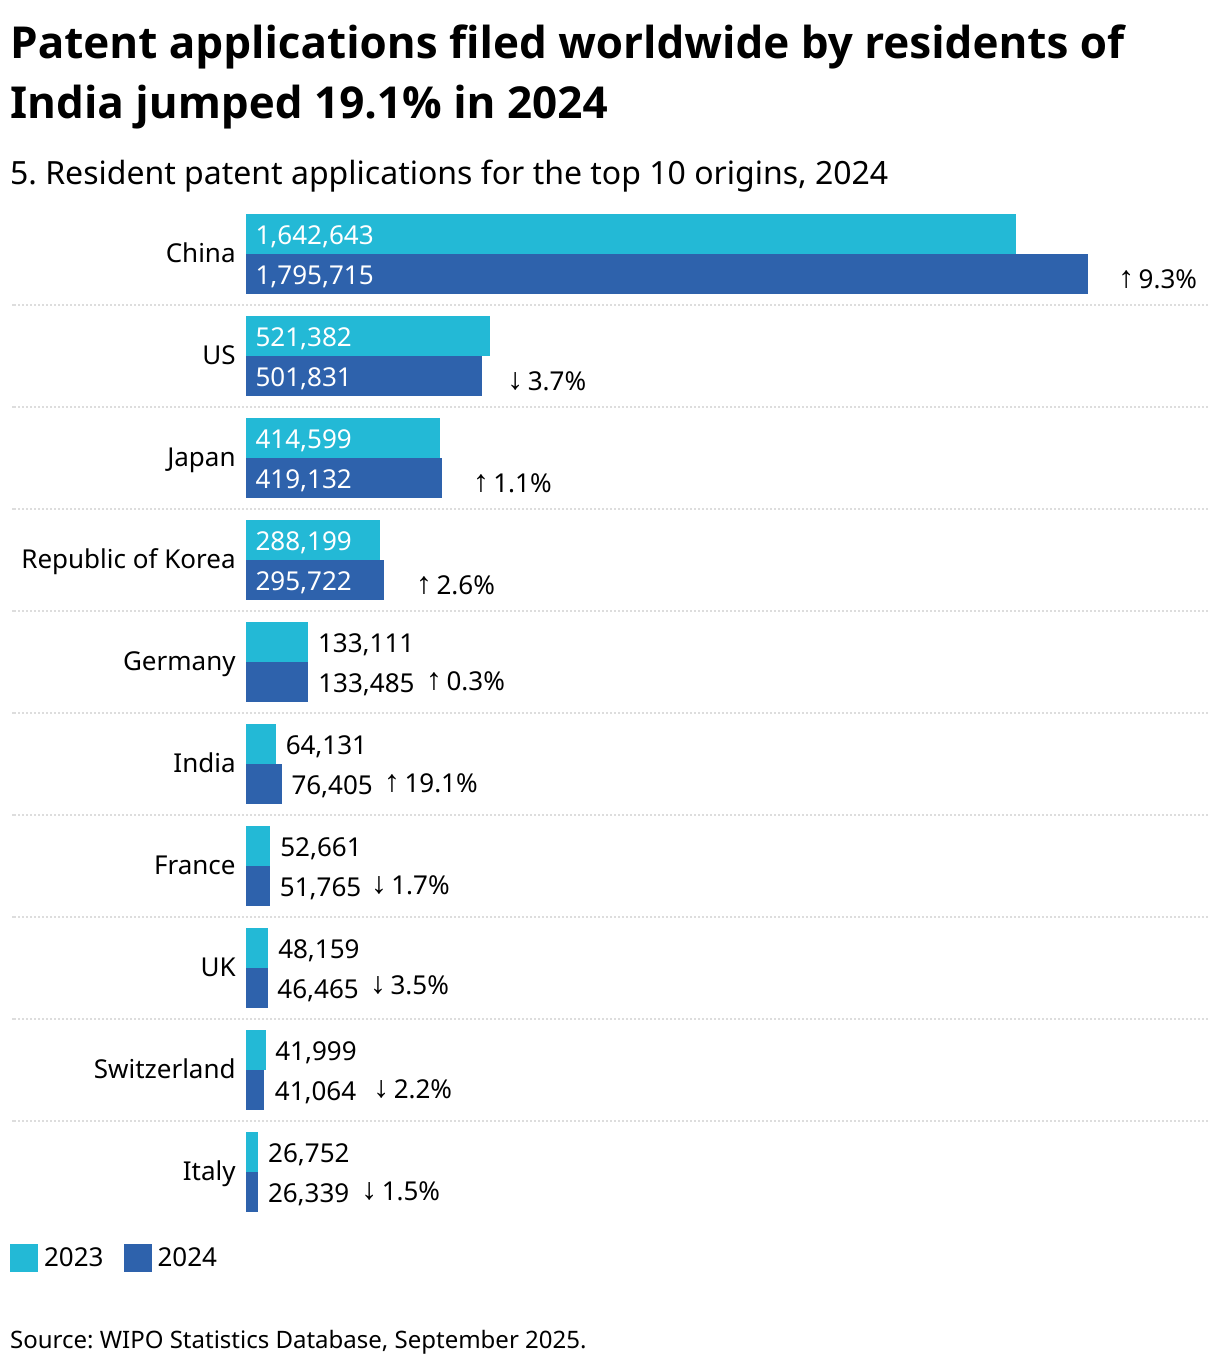
Applicants based in China filed around 1.8 million patent applications worldwide in 2024, followed by the US (501,831) and Japan (419,132). Patent applications filed worldwide by India-based applicants surged 19.1% globally in 2024, marking six straight years of double-digit growth, driven largely by growth in resident filings. China-based applicants (+9.3%) and those located in the Republic of Korea (+2.6%) also posted growth in 2024. For applicants based in China, resident filing was the main driver of overall growth. For those in the Republic of Korea, both resident and abroad filings contributed to the overall increase.
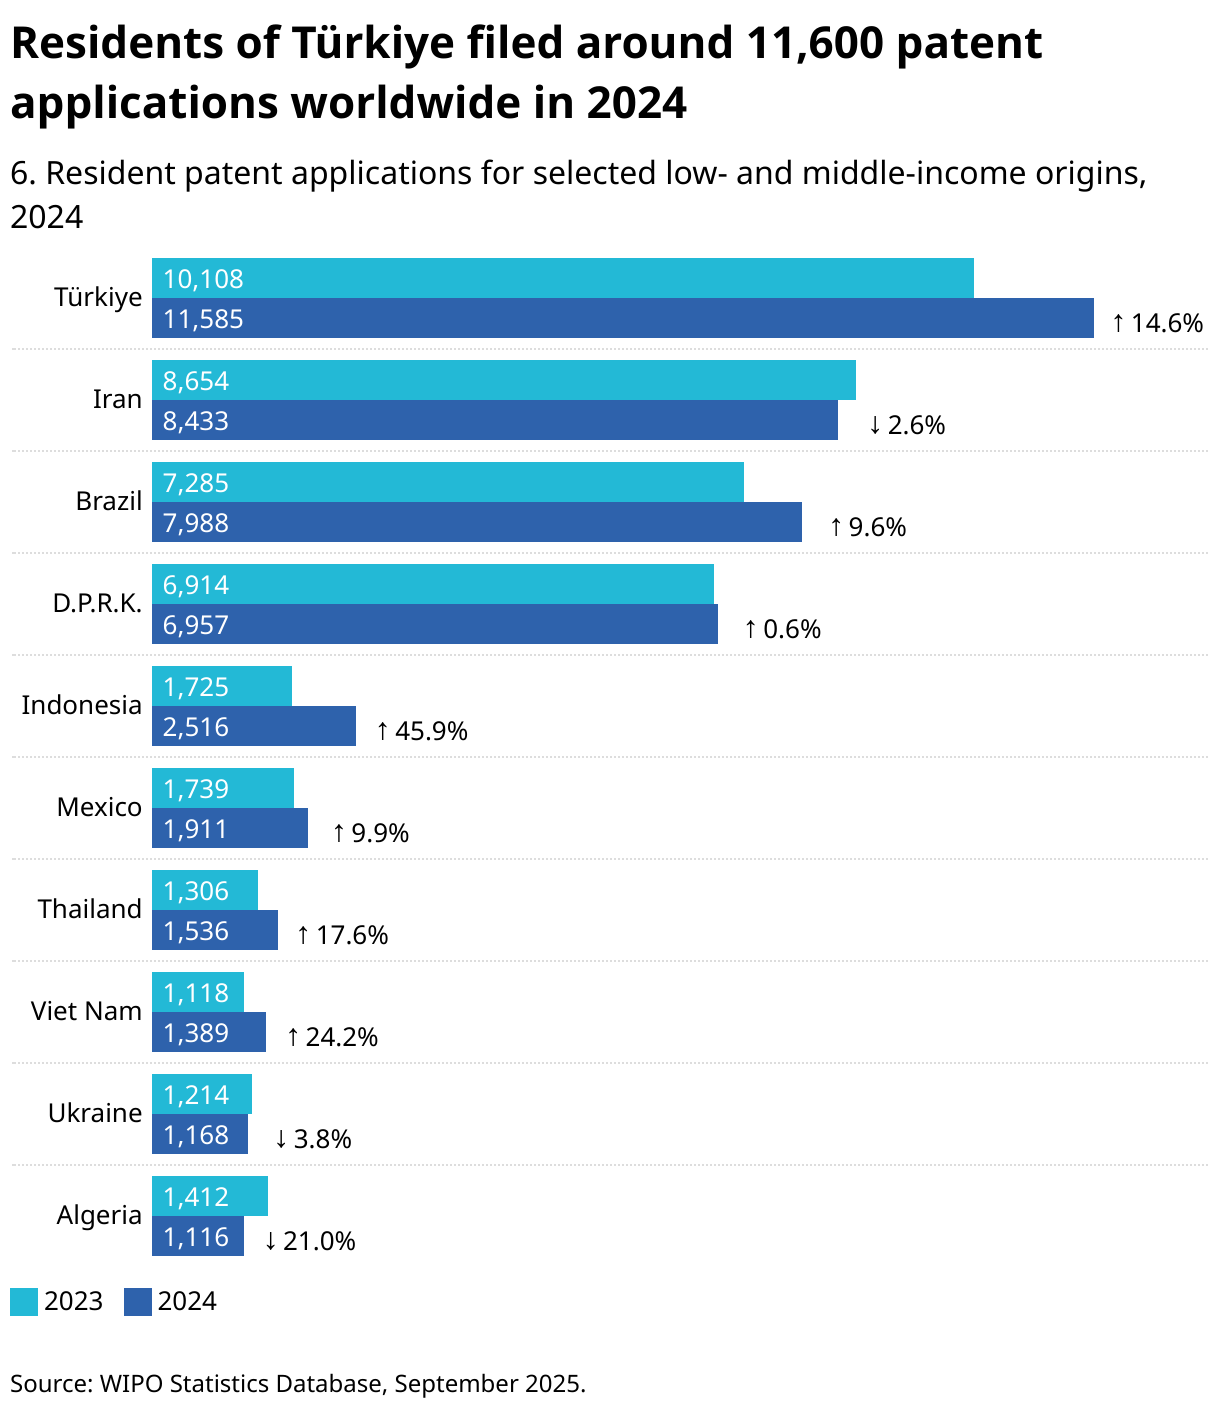
Among selected low- and middle-income origins, applicants based in Brazil (7,988), the Islamic Republic of Iran (8,433) and Türkiye (11,585) filed substantial numbers of patent applications in 2024. The majority of these were filed by residents of the respective countries ranging from 98.6% for the Islamic Republic of Iran to 72% for Brazil. Except for Mexico and Thailand, resident filings by applicants based in the other selected origins shown in figure 6 accounted for over 70% of total worldwide applications, indicating applicants’ strong emphasis on seeking patent protection within their domestic market. For the number of patent applications filed by residents of all other origins (where available), see statistical table 1.
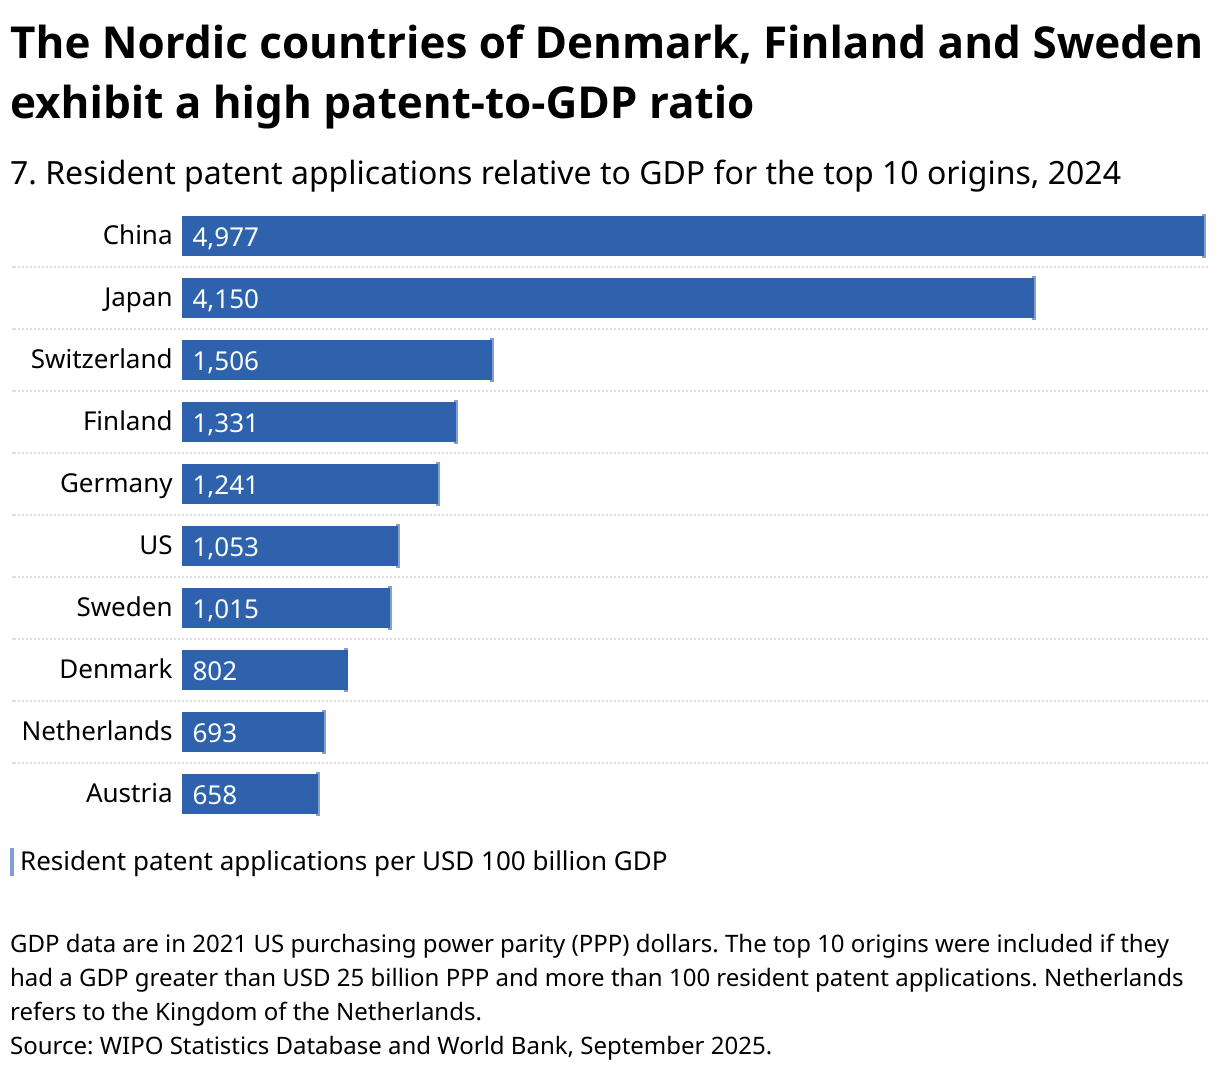
In 2024, patent applicants based in China were the most intensive filers relative to GDP, registering 4,977 resident applications for every USD 100 billion of GDP. They were followed by Japan (4,150), Switzerland (1,506), Finland (1,331) and Germany (1,241). Several origins with a relatively low resident patent application count, among them the Nordic countries of Denmark, Finland and Sweden, rank among the top 10 origins relative to GDP.
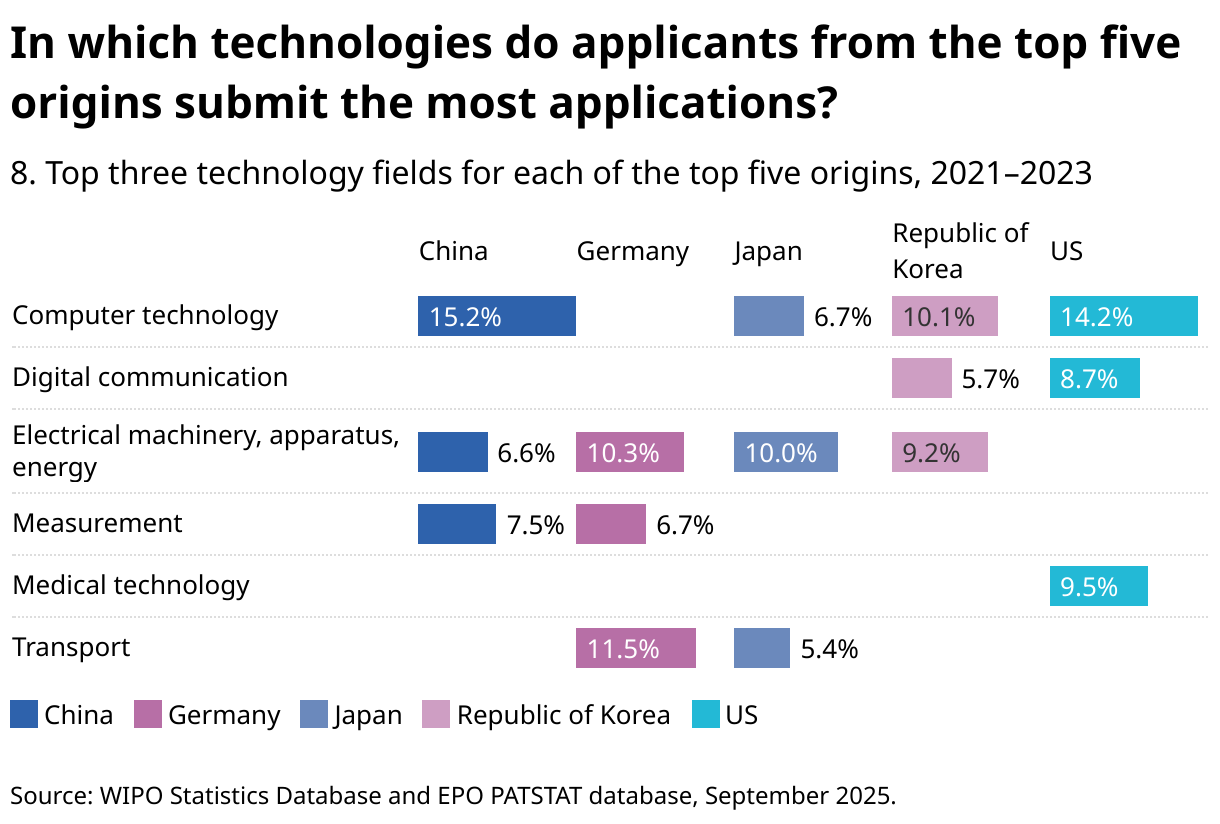
During the period from 2021 to 2023, applicants from three of the top five origins – China (15.2% of all published applications), the Republic of Korea (10.1%) and the US (14.2%) – filed most intensively in computer technology. In contrast, applicants based in Japan (10%) focused first on electrical machinery and those in Germany (11.5%) on transport.
A utility model (UM) is a special form of patent right. It has less stringent requirements than a patent but gives a shorter term of protection. Utility models are not available in every jurisdiction.
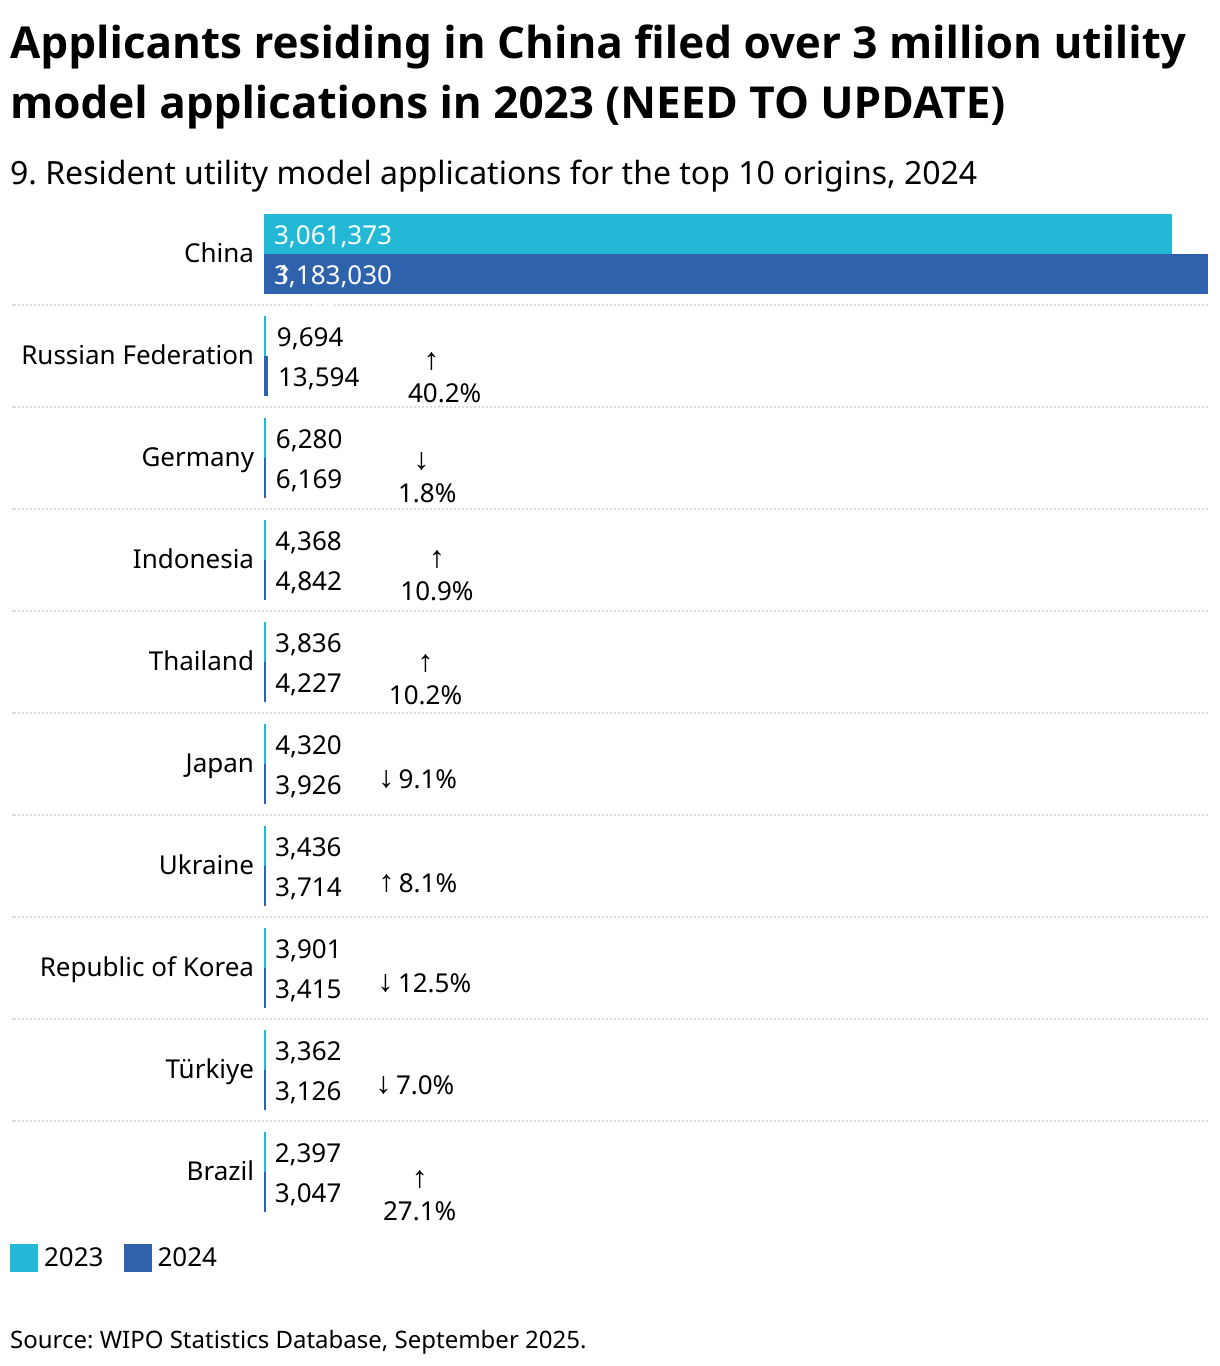
Utility model filings rose 4% in 2024, marking three consecutive years of growth, with worldwide applications totaling 3.3 million. Applicants residing in China accounted for the vast majority with around 3.2 million filings, far ahead of those based in the Russian Federation (13,594), Germany (6,169), Indonesia (4,842) and Thailand (4,277). Among the top 10 origins, Brazil (+27.1%), Indonesia (+10.9%), the Russian Federation (+40.2%) and Thailand (+10.2%) achieved double-digit growth in 2024.
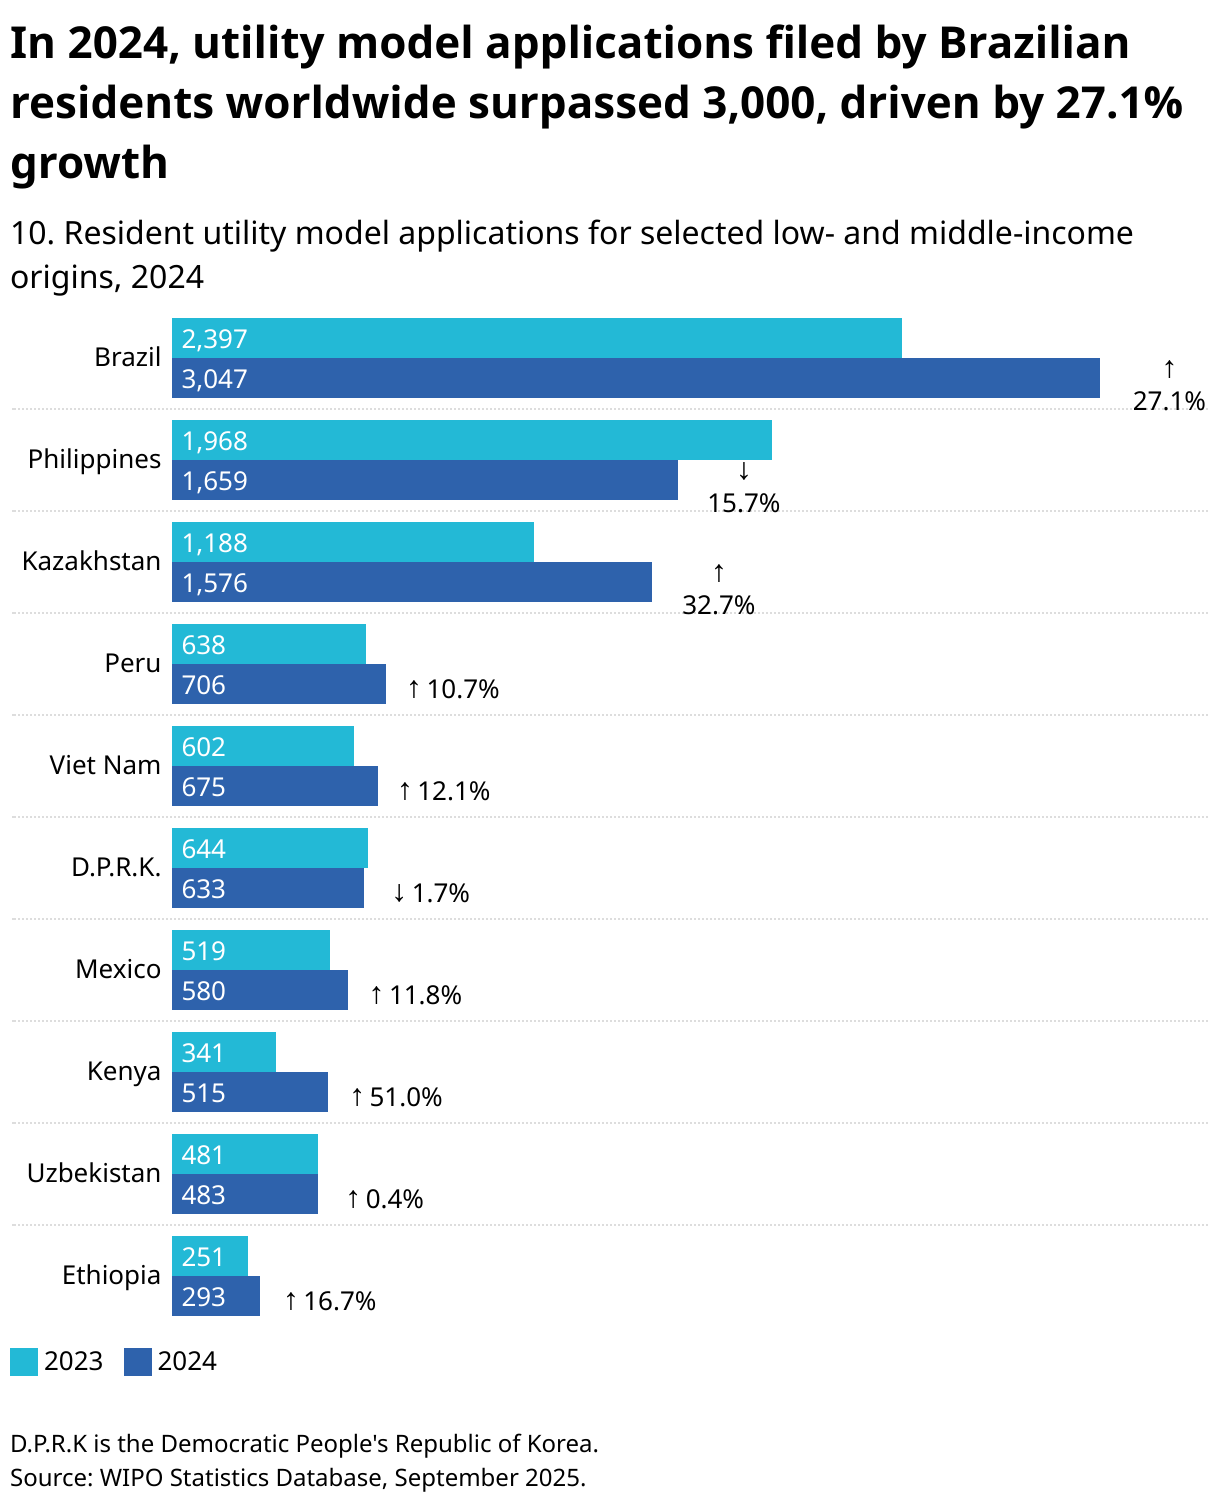
Figure 10 shows how many utility model applications were filed worldwide by applicants domiciled in a selection of low- and middle-income countries of origin in 2024. Residents of Brazil stood out with 3,047 applications, ahead of applicants based in the Philippines (1,659) and Kazakhstan (1,576). Filings by applicants based in three origins stood out for exceptional growth: Brazil increased by 27.1%, Kazakhstan by 32.7% and Kenya surged 51% compared to the previous year. For the number of utility model applications filed by residents of all other origins (where available), see statistical table 1.