
Rationale and origins
The Global Innovation Index (GII) evaluates the innovation performance of around 140 countries and of the top 100 innovation clusters, identifying strengths, weaknesses and data gaps.
Although the visible output of the GII is a comparative ranking, its core purpose is to advance a pathway toward a better measurement and a fuller understanding of innovation, together with the identification of effective policies and practices. The underlying dataset – at index, sub-index and indicator levels – allows for performance tracking over time and benchmarking against peers within similar regional or income groupings.
Defining innovation in the GII
The GII embraces an expansive conceptualization of innovation rooted in the foundational framework established by the Oslo Manual, developed jointly by Eurostat and the Organisation for Economic Co-operation and Development (OECD). The Oslo Manual’s fourth iteration in 2018 presented a refined and more encompassing definition of innovation: “An innovation is a new or improved product or process (or combination thereof) that differs significantly from the unit’s
This revision of the Oslo Manual simultaneously introduced comprehensive definitions relevant to business innovation and various categories of innovative enterprises. Within this framework, innovation manifests as enhanced outcomes achieved through novel goods and services, or integrated combinations thereof. The GII increasingly recognizes that innovation measurement must account for hybrid models that blur traditional boundaries between products and services, particularly within the digital economy, where platform-based innovations create entirely new value ecosystems.
How innovation is conceived has shifted considerably over recent decades. Earlier work focused largely on the R&D-driven product innovation taking place within manufacturing firms and performed by highly skilled staff in R&D-intensive organizations. Innovation was generally seen as a closed, internal and geographically concentrated process, with technological progress described as “revolutionary” and occurring at the “global knowledge frontier.” Such a view implied a divide between leading and lagging economies, leaving low- and middle-income countries in a “catch-up” position.
Innovation capability is now understood more broadly as being the ability to combine technologies in new ways, including through incremental change and “innovation without research.” Non-R&D investments are a key part of putting technology to productive use. The growth of frugal and reverse innovation illustrates how resource-constrained settings can produce breakthroughs that go on to reshape global markets. There is also growing attention to how innovation unfolds in low- and middle-income economies, including in informal sectors, and to the role of incremental innovation in development outcomes
The innovation process has also changed substantially over time. Investment in innovation-related activities and intangible assets has risen at the firm, national and global levels, drawing in new actors from beyond high-income economies, including non-profit organizations. Knowledge production has become more collaborative, more distributed across geographies and more complex than in earlier decades.
The GII has from the outset treated creativity and creative outputs as integral to innovation, rather than as a separate domain. In the view of the GII team, innovation and creativity are complementary facets of the same phenomenon.
A persistent challenge is to identify those metrics that capture innovation as it occurs today. Direct official measures of innovation outputs remain limited. There are, for instance, no official statistics on the volume of innovative activity (the count of new products, processes or other innovations) for any specific innovation actor, let alone for entire economies. Existing approaches also tend to overlook outputs from users, public and service sectors, as well as the informal mechanisms that often drive innovation in developing economies.
The GII aims to improve innovation measurement to give a more complete view of innovation ecosystems worldwide. The diffusion of artificial intelligence (AI)-enabled innovation tools and digital collaboration platforms has changed the pace and scale at which ideas can be tested, refined and deployed, prompting new measurement approaches that capture both human creativity and machine-augmented innovation. Attention is therefore given to continually perfecting the innovation metrics used. To advance measurement, WIPO launched in 2024 the GII iLens Innovation Data Lab series, which pilots new indicators and tests emerging data sources in priority areas such as innovation finance, startup ecosystems, deep science applications and innovation linkages. The Data Lab workshops focus particularly on big data sources and advanced analytical tools powered by AI, which are especially valuable when traditional statistics are subject to time lags or are unavailable. In addition, since 2022, a monthly GII Innovation Insights Blog explores in depth particular innovation indicators.
The GII conceptual framework
The GII’s conceptual framework rests on two equally weighted sub-indices that together capture innovation ecosystems: the Innovation Input Sub-Index and the Innovation Output Sub-Index. From these, three measures are produced:
Innovation Input Sub-Index: five pillars cover the economic conditions that enable innovation. The underlying premise is that today’s investments in scientific capacity, innovation infrastructure, human capital and a supportive innovation environment lay the groundwork for tomorrow’s innovation outputs.
Innovation Output Sub-Index: two pillars capture the results of innovative activity in the economy. Although the Output Sub-Index has fewer pillars, it carries the same weight as the Input Sub-Index in the overall GII score, which means output indicators receive proportionally greater weight than do input indicators.
Overall GII score: the simple average of the Input and Output Sub-Indices, from which the GII economy rankings are derived.
This year’s conceptual framework includes 79 different indicators, demonstrating a continuous evolution in addressing emerging innovation measurement challenges (see Economy profiles section for the complete Framework of the Global Innovation Index 2026). The seven pillars (five input, two output) each contains three sub-pillars, with individual indicators comprising each sub-pillar. Sub-pillar values are derived from the weighted averaging of indicator scores, normalized to generate 0–100 scale results. Pillar scores emerge through the weighted averaging of constituent sub-pillar values.
The idea of creating a global index on innovation – benchmarking economies worldwide on their innovation performance - began in 2007 as a magazine article. It is now produced by a United Nations specialized agency and used by governments to assess and shape innovation policy. Over this period, WIPO's role has grown from knowledge partner to sole publisher, and the GII has evolved from a single economy ranking into a wider set of innovation data and analysis – the so-called “GII family” – with a GII Global Innovation Tracker analyzing global innovation trends, the GII economy-wide innovation ranking, the GII’s ranking of the world’s Top 100 Innovation Clusters, as well as the biannual GII themes, such as “Powering entrepreneurs at the frontier of science” in this GII 2026 edition.
Origins as World Business magazine article, INSEAD and CII; 2007 to 2010
Soumitra Dutta, then a professor at INSEAD, and Simon Caulkin proposed the GII in a 2007 article in World Business magazine, which ranked 107 economies.
WIPO as knowledge partner and co-publisher, 2011 to 2020
The World Intellectual Property Organization (WIPO) – a United Nations specialized agency – joined as knowledge partner in 2011 and became co-publisher in 2012, alongside INSEAD and, from 2013 to 2020, Cornell University.
Since 2011, the partners worked to strengthen the technical rigor of the GII, with WIPO taking on a growing share of the technical work. At WIPO's initiative, the GII has been built in line with the Organisation for Economic Co-operation and Development (OECD)/Joint Research Centre (JRC) Handbook on Constructing Composite Indicators, and the European Commission's JRC has audited it every year since 2011.
In 2019, resolutions of the UN General Assembly and of the Economic and Social Council (ECOSOC) on science, technology and innovation referred to the GII as a tool for measuring national innovation systems.
WIPO as sole publisher, 2021
In 2021, WIPO became the sole publisher of the GII. WIPO brought all production in-house: the framework, data collection and quality control, modelling, drafting, dissemination and engagement with Member States. This required a dedicated technical and governance infrastructure, described below. Coverage has also widened. The GII 2026 ranks 139 economies, which account for 95.5 percent of the world's population and 98 percent of world GDP in purchasing power parity terms, using 79 indicators grouped into seven pillars and 21 sub-pillars. The set of indicators used in the GII has been overhauled significantly in 2013, and progressively but more incrementally since.
From 2021 to 2025, WIPO had an agreement with the Portulans Institute to coordinate the GII Academic Network, and to promote the GII’s dissemination.
Beyond the economy ranking
In 2017, WIPO added a ranking of the world's top 100 science and technology clusters to the GII. It was based first on the location of inventors named in patent applications, and scientific authors. In 2025, venture capital deals were added as a third metric and the ranking was renamed the Top 100 Innovation Clusters. Since 2022, WIPO has released the cluster ranking ahead of the full GII report. City and provincial governments in particular use it to benchmark their local innovation ecosystems.
In 2021, WIPO introduced the Global Innovation Tracker, which follows global trends in science and innovation investment, technological progress, technology adoption and socioeconomic impact. The special theme, a feature of earlier editions, has been published every two years since 2022 and draws on contributions from outside experts. The GII 2026 theme is deep science entrepreneurship. Since late 2022, the GII Innovation Insights series has examined individual indicators in more depth, and since 2024 the GII-iLens Innovation Data Lab has tested new data sources and pilot indicators, for example on innovation finance, startups and deep science.
Governance and quality assurance
The rankings are produced under strict governance arrangements designed to safeguard the independence of the GII development process. Methodological decisions are taken by a technical expert model review committee in the GII team, independently of rank outcomes; neither Member States nor WIPO management take part in the model review. The methodology is documented in a single technical reference produced by the GII WIPO Secretariat, and methodology and data are transparent and reproducible, so that researchers and other third parties can replicate the GII and reuse its data. The JRC audit, published each year in Appendix II, tests the statistical soundness of the index and the robustness of the rankings. In 2023, an audit of the GII by WIPO's Internal Oversight Division found no critical issues. It recommended clearer governance arrangements and certain methodological refinements
Data infrastructure
Since 2021, WIPO has built a dedicated data infrastructure covering data storage, coding, model calculation, quality control and visualization. It has five parts:
The GII database: stores all collected data in structured form for every WIPO Member State (not only ranked GII economies) and for all indicators, together with the outlier records arising from quality checks. Since 2024, it has also held the country-level and global data for the Global Innovation Tracker, and the micro-level data (often company-related) used for certain indicators, such as global corporate R&D investors, unicorn valuation, intangible asset intensity, global brand value and top universities.
Code repository on GitHub: contains the R code and applications for each stage of the workflow, including data collection, calculation and quality control across all indicators. Since 2024, it has included the code for the country-level trend calculations of the Global Innovation Tracker.
The GII2 R-package: a custom-built R-package for calculating the GII model and analyzing its results. Its structure follows the COINr R-package developed by the JRC and the steps set out in the OECD/JRC Handbook on Constructing Composite Indicators.
Quality control: each indicator undergoes an annual quality control process, with tests of means, outliers (z-scores on unscaled and scaled data), rank changes, and missing or outdated data. The GII team then asks data providers for clarification or source-level corrections when needed.
GII Innovation Ecosystems & Data Explorer: since 2024, the Explorer, developed with OneTandem, allows users to generate GII economy briefs and profiles, compare economies, and access time series for every indicator, including micro-data on intangible assets, top universities and the most valuable brands. Individual cluster briefs were added in 2024 and regional briefs in 2025. The Explorer is available in English and Spanish and works on mobile devices. A separate GII Economy Monitoring Board report (available on request) tracks the data status of economies not yet ranked and flags missing or outdated indicators, to support economies working toward inclusion.
Use by Member States
WIPO's engagement with Member States has grown to some 80 national and regional events and missions every year, including workshops on the GII model, country innovation data and policy implications, as well as inter-ministerial task forces. In the 2026 WIPO Member State survey, 78 percent of responding Member States reported using the GII, most often to improve innovation ecosystems and policy (63 percent), to improve innovation data (53 percent) and as a reference in economic plans and policies (41 percent).
Interest in sub-national innovation indices modelled on the GII continues to grow. WIPO has supported such efforts since 2022 and has expanded its work on defining and measuring sub-national innovation, including by convening countries to share experiences (WIPO, 2024).
Adjustments to the GII model in 2026
Appendix 1 Table 1 summarizes the adjustments made to the GII 2026 framework. The methodology has changed for one indicator (3.3.2). In addition, there are two new indicators, and one indicator has been dropped from the framework. Due to the addition and removal of these indicators, the numbering of three indicators has been adjusted, but without altering the methodology.

Data limitations and treatment
The timeliest possible indicators are used for the GII 2026: from the non-missing data, 4.1 percent are from 2026, 31.4 percent from 2025, 44.7 percent from 2024, 10.4 percent from 2023, 4.7 percent from 2022, 1.3 percent from 2021, and the small remainder of 3.5 percent are from earlier years.
The 79 indicators included in the GII 2026 model are of three types:
quantitative/objective/hard data (64 indicators);
composite indicators/index data (10 indicators); and
survey/qualitative/subjective/soft data (5 indicators).
This year, for an economy to feature in the GII 2026, the minimum data coverage required is at least 36 indicators in the Innovation Input Sub-Index (66 percent) and 16 indicators in the Innovation Output Sub-Index (66 percent), with scores for at least two sub-pillars per pillar. Since the GII 2024, indicator 6.1.3 – Utility models by origin/bn PPP$ GDP has been excluded from the minimum data coverage (DMC) requirement. In the GII 2026, 139 economies had sufficient data available to be included in the Index. A total of 109 economies did not make it into the GII 2026 because of a lack of available data. For each economy, only the most recent yearly data were considered. As a rule, the GII indicators in the 2026 edition consider data from as far back as 2016.
Missing values
For the sake of transparency and the replicability of results, missing values are not estimated; instead, they are indicated with “n/a” and are not considered in the sub-pillar score. In other words, missing indicators do not translate into a zero for the country in question; rather, the indicator is simply not taken into consideration in the aggregation process.
That said, the audit undertaken by the European Commission’s Competence Centre on Composite Indicators and Scoreboards at the Joint Research Centre (JRC-COIN) (see Appendix II) assesses the robustness of the GII modeling choices (no imputation of missing data, fixed predefined weights and arithmetic averages) by imputing missing data, applying random sets of perturbed weights and using geometric averages. Since 2012, based on this assessment, a confidence interval has been provided for each ranking in the GII, as well as for the Input and Output Sub-Indices (Appendix II).
Treatment of series with outliers
Potentially problematic indicators with outliers that could polarize results and unduly bias the rankings were treated according to the rules listed below, as per the recommendations of the JRC-COIN. Only hard data indicators were treated (32 out of 64).
First rule: selection
Indicators were classified as problematic if they had:
an absolute value of skewness greater than 2.25; and
kurtosis greater than 3.5.
(8)Based on Groeneveld and Meeden (1984)Groeneveld, R.A. and G. Meeden (1984). Measuring skewness and kurtosis. The Statistician, 33(4), 391–399. , which sets the criteria of absolute skewness above 1 and kurtosis above 3.5. The skewness criterion was relaxed to accommodate the small sample under consideration (139 economies).
Second rule: treatment
Indicators with between one and five outliers (23 cases) were winsorized; the values distorting the indicator distribution were assigned the next highest value, up to the level where skewness and/or kurtosis had the values specified above.
Indicators with five or more outliers, and for which skewness or kurtosis did not fall within the ranges specified above, were transformed using natural logarithms after multiplication by a given factor f.
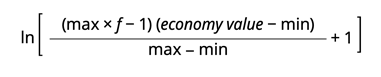
where “min” and “max” are the minimum and maximum indicator sample values, respectively.
Normalization
The 79 indicators were then normalized into the [0, 100] range, with higher scores representing better outcomes. Normalization was undertaken according to the min–max method, where the “min” and “max” values were the minimum and maximum indicator sample values, respectively. Following the recommendation of the JRC-COIN, all indicators, including index and survey data, were normalized to a 0–100 range. Such normalization ensures that all indicators share the same range, facilitating their individual contribution to the overall index score.
Weights
In 2012, the JRC-COIN and GII team made a joint decision that scaling coefficients of 0.5 or 1.0 should be used instead of importance coefficients. This decision aimed to achieve balanced sub-pillar and pillar scores by considering the underlying components. In other words, the goal was to ensure that indicators and sub-pillars contribute a similar amount of variance to their respective sub-pillars/pillars.
To prevent multicollinearity during the aggregation process, any indicators within a sub-index that exhibited a high correlation, exceeding an absolute correlation of 0.95, were assigned a weight of 0.5. In 2026, there were two indicators that received a 0.5 weight – indicators 1.2.1 and 1.2.2. All other indicators had a weight of 1. Additionally, two sub-pillars – 7.2 Creative goods and services and 7.3 Online creativity – were also assigned a weight of 0.5.
Strengths and weaknesses
Strengths and weaknesses are calculated for all economies covered in the GII and are presented in the individual economy profiles (see the explanatory section, Economy profiles) and in the GII Economy briefs available through the GII Innovation Ecosystems & Data Explorer. In simple terms, strengths and weaknesses are the top- and bottom-ranked indicators for each country. In addition, income group strengths and weaknesses are also provided, which are the respective high- and low-performing indicators within income groups.
The methodology for the calculation of strengths and weaknesses is as follows:
The scores of each indicator are converted to percentile ranks.
Strengths are defined as those indicators of an economy that have a percentile rank greater than or equal to the 10th percentile rank (across the indicators of that economy). This can result in more than 10 strengths in the event of tied results.
Weaknesses are defined in an equivalent manner for the bottom 10 indicators.
If a country has an indicator that ranks equal to or lower than three, it is automatically a strength, regardless of the percentile rank.
Importantly, although the cut-off value used to define the strengths (i.e., the 10th highest percentile rank) is calculated using only indicator percentile ranks, it is also applied to pillars and sub-pillars.
In addition, for pillars and sub-pillars that do not meet the data minimum coverage (DMC) criteria, strengths and weaknesses are not signaled. Pillars and sub-pillars that do not meet the DMC are presented in brackets in the economy profiles.
Income group strengths and weaknesses are like overall strengths and weaknesses, but defined within income groups and use means and standard deviations. The methodology for calculation is as follows:
For a given economy, income group strengths are those scores that are above the income group average plus the standard deviation within the group.
For that economy, weaknesses are those scores that are below the income group average minus the standard deviation within the group.
The only exceptions to the income group strengths and weaknesses are the top 25 high-income economies, where these strengths and weaknesses are computed within the top 25 group only.
As the only non-high-income economy in the top 25, China’s income group strengths and weaknesses are computed relative to the non-top 25 group.
Since, occasionally, the low threshold for weaknesses is below zero, any score of zero is automatically marked as a weakness.
Finally, as of 2023 and following the recommendation of the audit by the WIPO Internal Oversight Section,
(11)IOD Ref: IA 2022-03, April 14, 2023, available at: https://www.wipo.int/documents/d/about-wipo/docs-en-oversight-iaod-audit-audit-gii.pdf. strengths and weaknesses are reset, or not signaled, where the data year for a given indicator is older than the indicator mode minus five years. In practice, for the GII 2026, this means that for indicators with a data year mode of 2024, the data year of an economy must be 2019 or later to qualify as a strength or weakness.
Caveats regarding the year-to-year comparison of rankings
The GII tracks the performance of national innovation systems across economies globally and presents changes in economy rankings over time.
While year-on-year comparisons can provide useful insights into trends, it is important to note that scores and rankings are not directly comparable between one year and another. Each ranking reflects the relative position of a particular economy based on the conceptual framework, the data coverage and the sample of economies of a given year. Rankings may also be influenced by changes in the underlying indicators at source and in data availability, which can affect comparability across editions.
Several factors influence the year-on-year rankings of an economy:
the actual performance of the economy in question;
adjustments made to the GII framework (changes in indicator composition and measurement revisions);
data updates, the treatment of outliers and missing values; and
the inclusion or exclusion of economies in the sample.
Additionally, the following characteristics complicate a time-series analysis based on simple GII rankings or scores:
Missing values: the GII produces relative index scores, which means that a missing value for one economy affects the index score of other economies. Because the number of missing values decreases every year, this problem reduces over time.
Reference year: the data underlying the GII do not refer to a single year, but to several years, depending on the latest available year for any given indicator. In addition, the reference years for different indicators are not the same for every economy, due to measures to limit the number of missing data points.
Scaling factors: most GII indicators are scaled using either GDP or population, with the intention of enabling cross-economy comparability. However, this implies that year-on-year changes in individual indicators may be driven either by the variable (numerator) or by its scaling factor (denominator).
Consistent data collection: measuring the change in year-on-year performance relies on the consistent collection of data over time. Changes in the definition of indicators or in the data collection process could create movements within the rankings unrelated to performance.
A detailed study at the economy level based on the GII database and the economy profiles over time, coupled with analytical work on the ground, including that of innovation actors and decision-makers, yields the best results in terms of monitoring an economy’s innovation performance, as well as identifying possible avenues for improvement.
References
Dutta, S. and S. Calkin (2007) The world's top innovators.World Business, 8 (January/February), 26–37. Available at: https://mastic.mosti.gov.my/publication/global-innovation-index-2007-1th-edition.
Groeneveld, R.A. and G. Meeden (1984). Measuring skewness and kurtosis. The Statistician, 33(4), 391–399.
Kraemer-Mbula, E. and S. Wunsch-Vincent (eds) (2016). The Informal Economy in Developing Nations: Hidden Engine of Innovation? (Intellectual Property, Innovation and Economic Development). Cambridge and Geneva: Cambridge University Press and World Intellectual Property Organization.
OECD (Organisation for Economic Co-operation and Development) and Eurostat (2018). Oslo Manual 2018: Guidelines for Collecting, Reporting and Using Data on Innovation (4th edition). Paris and Luxembourg: OECD and Eurostat. Available at: https://doi.org/10.1787/9789264304604-en.
United Nations Economic and Social Council (2019) Science, technology and innovation for development. Resolution E/RES/2019/25, adopted on 23 July 2019. New York: United Nations. Available at: https://unctad.org/system/files/official-document/ecosoc_res_2019d25_en.pdf
United Nations General Assembly (2019). Science, technology and innovation for sustainable development. Resolution A/RES/74/229. Available at: https://digitallibrary.un.org/record/3847342?v=pdf
WIPO (World Intellectual Property Organization) (2024). Enabling Innovation Measurement at the Sub-National Level: A WIPO Toolkit. Geneva: WIPO. Available at: https://doi.org/10.34667/tind.48577.