
Global leaders in innovation, 2026



Key takeaways
1. In 2025, innovation investments largely positive again after the 2023 downturn, but growth mostly below trend
↑ Overall picture positive in 2025: Across all four parts of the GII Global Innovation Tracker results are more uniformly positive than in recent editions; only three indicators moved in a less favorable direction: venture capital (VC) deal counts, renewable energy costs and global temperatures, while all other indicators moved in a favorable direction; four grew faster than the 10-year trend: scientific publications, VC deal values, cancer radiotherapy availability and labor productivity. Growth remained below the decade average elsewhere.

↑ Scientific publications hit a new global record: Global research output surpassed 2.4 million articles last year, growing 6.9 percent above its long-run trend.
↗ Global R&D growth solid, China edges ahead of the United States: Global R&D expenditure grew by 4.7 percent in real terms in 2024, when China’s total R&D spending moved slightly ahead of the United States. The rest of the world is projected to grow by around 2 percent, with R&D capacity spreading to middle-income economies such as Egypt, Indonesia, Malaysia and Viet Nam.
Global R&D intensity is holding close to 2 percent of GDP, up from 1.2 percent three decades ago, though its rise has plateaued. Global R&D is projected to have moderated to 3.3 percent in 2025 and be 3.6 percent in 2026, above GDP growth.

↗ Corporate R&D hits a record: Corporate R&D expenditure among the world’s top spenders stood at a record USD 1.5 trillion last year, growing 5.8 percent in real terms from 2024. This expansion is increasingly driven by software and artificial intelligence (AI)-intensive firms, though aerospace and defense R&D rose sharply as well.
↘ Venture capital (VC) values recover, but activity narrows: VC deal values increased by around 28 percent to USD 510 billion last year, the strongest annual gain since 2021. AI accounted for 53 percent of global VC deal value in 2025, surging to 77 percent in the first half of 2026. However, deal counts fell by 1.4 percent, a fourth consecutive annual decline. Still, VC is developing beyond the known hubs: African startups raised about USD 3.2 billion last year, up some 40 percent on 2024.


↗ International patent filings continue to expand, but below trend: Patent applications under the Patent Cooperation Treaty (PCT) increased by 0.7 percent, a second consecutive year of moderate growth.
2. Technological progress: continued advances at a slower pace
Technology advanced on almost every front in 2025, though at a slower pace than over the past decade.
Supercomputing efficiency and transistor counts on frontier chips both rose, though below their long-run rates.
The average global battery price fell to a record low of USD 108 per kWh, with China lowest at USD 84, while solar and wind power costs rose for the first time since 2014.
Genome sequencing costs fell by around 12 percent, in line with the decade trend, and drug approvals increased again, led by oncology and immunology, though below the long-run average.
3. Technology adoption: wider diffusion with uneven access
Technology adoption widened across every indicator in 2025, but each grew below its long-run trend; a sign that diffusion is slowing.
The global EV stock reached 75 million, electric cars made up about a quarter of new car sales, and the high-speed rail network reached 67,723 km, led by China, with momentum building in the Asia-Pacific and Middle East regions.
5G networks now reach 55 percent of the global population, though access is uneven, and robot deployment rose around 9 percent to 4.7 million in 2024, helped by middle-income economies such as India, Mexico and Viet Nam.
Cancer radiotherapy availability continued to improve, but coverage remains limited in low-income economies.
4. Socioeconomic impact: social gains continue, climate pressures persist
Innovation delivered welfare gains in 2025, even as climate pressures persist.
Labor productivity rose 2.7 percent, now above its 10-year trend; a key question is whether AI-related investment will trigger wider productivity gains or stay confined to a few firms.
The share of the global population living below USD 3 per day fell to about 10 percent, and life expectancy reached 73.5 years as the post-pandemic recovery takes hold.
Global temperatures reached the second highest level on record, with the first half of 2026 running even warmer.
5. In a turbulent year, the innovation frontier holds: Switzerland, Sweden and the United States lead again
Switzerland (1st, for a 16th consecutive year), Sweden (2nd) and the United States (3rd) remain the world’s top three innovation economies, with the Republic of Korea (4th) and Singapore (5th) close behind. No new economy enters the top 15.
Europe again accounts for the largest share of the top innovation economies, claiming 14 of the top 25. The Kingdom of the Netherlands moves up to 7th and Austria to 18th.
Asia takes five places: China (10th) remains the only middle-income economy among the leaders, Japan stays 12th and Hong Kong, China rises to 14th.
Beneath the continuity there is movement: the United Arab Emirates enters the top 25, while Canada (16th), Australia (20th) and New Zealand (24th) regain ground. Their recoveries share a pattern: mature innovation systems strengthening their academic base, university–industry links and research investment.
6. A few other economies reach key milestones including Portugal, Latvia, Kuwait and Costa Rica; Bhutan joins the GII
Portugal (30th) reaches the top 30.
Lithuania moves up to 32nd and Latvia enters the top 40 (40th).
Kuwait (62nd) and Costa Rica (70th) advance into the top 70, and Bhutan enters the GII, at 74th. Its entry follows a multi-year collaboration with WIPO on improving the availability of innovation indicators.
7. Middle-income economies keep climbing, but an innovation glass ceiling is becoming more apparent
China (10th), India (38th), Viet Nam (43rd), Türkiye (45th), the Philippines (52nd), Morocco (54th) and Indonesia (55th) have advanced most among middle-income economies since 2013. Morocco reaches its best rank ever; Viet Nam returns to its pre-pandemic level.
The innovation outputs of these emerging economies now often exceed inputs: China ranks 5th in outputs against 22nd in inputs, India 25th against 49th and Viet Nam 35th against 54th.
A benchmarking against high-income and middle-income medians points to selective rather than uniform convergence. Convergence has been easiest in production and exports, startup finance and intellectual property, and hardest in the knowledge base and R&D, where research capacity builds slowly. The long-term climbers have not yet reached high-income performance across the entire innovation system. China, the exception, reaches high-income levels in 21 of 25 benchmarked indicators.
The routes differ: India climbs through digital services and venture capital, leading the world in ICT services exports; Viet Nam and the Philippines through high-tech manufacturing and trade, while still trailing in domestic invention; Türkiye through industrial design and branding; and Indonesia through its large domestic market and startup finance, on a still thin R&D base of around 0.3 percent of GDP.
The next stage of catch-up will depend on whether these strengths can be complemented by deeper research systems, broader knowledge creation and stronger connections across the innovation ecosystem.
8. Since 2019, a newer wave of climbers has gathered pace, powered by investment, digital transformation and services
Saudi Arabia (42nd), Qatar (47th), Mauritius (50th), Brazil (53rd), Jordan (60th) and Bahrain (64th) recorded some of the strongest advances since 2019 among the top 70.
The Gulf economies climb through investment in digital infrastructure, finance and talent as part of state-led diversification: Saudi Arabia leads the world in ICT use, and Riyadh enters the top 100 innovation clusters; Qatar ranks 1st in tertiary inbound mobility; Bahrain 1st in ICT access, with one of the world’s best business environments; and Jordan takes a knowledge-intensive route, ranking 1st in scientific articles.
Mauritius shows how a small economy can diversify through services, ranking 6th both in cultural and creative services exports and in VC investors.
Brazil pairs Latin America’s deepest science and R&D base with strong trademark activity and late-stage VC, anchored by São Paulo among the top-100 innovation clusters.
The test for this second group is similar: to avoid a plateau by turning recent gains into broader, sustained innovation performance.

9. Who converts inputs into outputs?
China is the most prominent outlier with a high ratio of outputs to inputs, even compared with high-income economies.
Several middle-income economies do more with less: Morocco ranks 76th in inputs, but 46th in outputs, with the Islamic Republic of Iran, Mexico, Tunisia, Türkiye and Viet Nam showing similar patterns, and Madagascar, Nigeria, Pakistan and Zimbabwe also producing more than their inputs would suggest.
Qatar, Saudi Arabia and the United Arab Emirates show the reverse: strong institutional, infrastructure and investment foundations, with conversion into results the necessary next step.
10. Switzerland, China, India and Rwanda lead their income groups; momentum in Africa
Malaysia (34th), Viet Nam (43rd), Thailand (44th) and Türkiye (45th) reinforce the growing presence of middle-income economies in the upper half of the ranking.
In Europe, 12 economies improve, including Italy (27th) and Spain (28th); the region’s central challenge, echoed in competitiveness debates, is to convert its research and industrial strengths into fast-growing firms, scaleup finance and productivity growth.
Chile (51st) leads Latin America and the Caribbean, ahead of Brazil (53rd), Mexico (65th), Uruguay (66th) and Costa Rica (70th). Assets remain concentrated in a few economies, and research, entrepreneurship and market access are not yet connected strongly enough to form a regional engine.
India leads Central and Southern Asia, ahead of Kazakhstan (73rd) and Bhutan (74th). The region consolidates its lead over Latin America and the Caribbean on the strength of its innovation outputs.
Morocco leads a North African rise, pairing industrial upgrading with the business use of intangible assets, from industrial designs to trademarks and high-tech manufacturing. Tunisia builds on human capital and science, ranking 1st in science and engineering graduates; Egypt combines a large domestic market, a substantial scientific base and R&D spending above 1 percent of GDP; Algeria invests in education at among the highest rates worldwide.
Sub-Saharan Africa shows some of the year’s most encouraging momentum: Mauritius reaches the top 50; South Africa marks nine consecutive years of overperformance; Rwanda posts the strongest low-income advance, backed by strong institutions (26th); and Botswana and Kenya move up on growing use of trademarks, utility models and industrial designs, alongside a growing VC layer around selected hubs.
11. New green-field R&D and high-tech FDI indicator: investment is highly concentrated, but middle-income magnets emerge
The GII 2026 introduces a green-field R&D and high-tech FDI indicator, based on announced investment projects. Firms announced close to 6,000 such projects in 2025, roughly one in three of all green-field projects worldwide.
Investment is concentrated: the top 10 destinations attracted 58 percent of projects, led by the United States, India and the United Arab Emirates.
Sixteen economies are global investment hubs, above the world average on both inflows and outflows; China and India are the middle-income economies among them. Fourteen investment magnets, 10 of them middle-income, attract far more than they invest abroad, with Mexico the strongest.
12. Twenty-one economies innovate above their level of development, led by India and Viet Nam for a 16th year
The GII 2026 identifies 21 innovation overperformers, four more than in 2025. India and Viet Nam remain the longest-standing, at 16 consecutive years; the Republic of Moldova returns with 15 appearances; Rwanda and Ukraine count 14 each.
Bhutan, Mozambique and Pakistan also overperform.
Ten of the 21 are lower middle-income economies; Sub-Saharan Africa hosts the largest number (seven), and Brazil remains the only overperformer in Latin America and the Caribbean, for a sixth consecutive year.
Thirty-nine economies perform below expectations, most in Latin America and the Caribbean.
Pillar imbalances often mark assets rather than weaknesses: Rwanda ranks 26th in Institutions, Algeria 39th in Human capital and research and Cambodia 31st in Market sophistication, all well above their overall ranks; the task is to build channels that turn these strengths into broader performance.
The wider lesson: innovation success depends not only on resources, but on how effectively economies connect research, firms, finance, skills, institutions and markets into a functioning ecosystem.
The results point to four conclusions: the innovation frontier is persistent but not frozen; middle-income catch-up is real, but faces a glass ceiling that so far only China has broken; innovation momentum is spreading through distinct regional pathways; and income alone does not determine innovation performance.
The policy implication is system coherence: the priority is not to raise inputs or target a higher rank, but to strengthen the paths through which institutions, skills, infrastructure, finance, firms and creative capabilities reinforce one another.
13. The world’s top innovation clusters span six out of the seven continents, with Shenzhen–Hong Kong–Guangzhou leading globally for a second year
Shenzhen–Hong Kong–Guangzhou (China and Hong Kong, China) again tops the GII top 100 innovation cluster ranking, followed by Tokyo–Yokohama (Japan), San Jose–San Francisco (United States), Beijing (China), and Seoul (Republic of Korea). All five top clusters held their positions from last year, underscoring the stability at the top of the ranking.
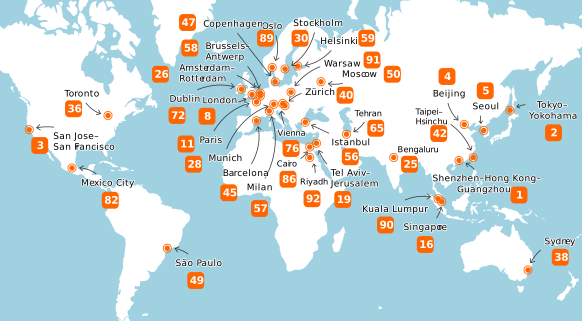 Note: Squares with numbers show cluster ranks.
 Map: © OpenMapTiles, © OpenStreetMap contributors https://www.openstreetmap.org/copyright.
China and the United States lead the innovation cluster count for a fourth consecutive year, with China now hosting 25 and the United States 20.
Germany follows with seven clusters (led by Munich, 28th), then India (led by Bengaluru, 25th) and the United Kingdom (led by London, 8th) with four each.
Beyond the clusters of China and India, São Paulo (49th, Brazil); Cairo (86th, Egypt); Tehran (65th, Islamic Republic of Iran); Kuala Lumpur (90th, Malaysia); Mexico City (82nd, Mexico); and Istanbul (56th, Türkiye) are the middle-income clusters in the top 100.
Riyadh (92nd, Saudi Arabia) enters the top 100, while Ningde (China) records the largest rank gain, climbing 24 places (99th to 75th).
14. San Jose–San Francisco and Cambridge are the most innovation-intensive clusters, with several smaller hubs close behind
San Jose–San Francisco (United States) and Cambridge (United Kingdom) retain the top two positions by innovation intensity relative to population. Ningde (China) rises to 3rd place, driven by Contemporary Amperex Technology Co. (CATL).
Boston–Cambridge (United States) and Oxford (United Kingdom) round out the top five.
Daejeon (Republic of Korea) enters the top 10 intensity ranking.
Eindhoven (8th, Kingdom of the Netherlands) and Helsinki (9th, Finland) lead the European Union (EU) by intensity with five EU clusters ranking among the intensity top 15.
A new comparison of scale and intensity shows that only San Jose–San Francisco and Boston–Cambridge rank in the global top 10 on both counts. Göteborg (Sweden) has the widest gap, 100th globally, but 18th by intensity; Delhi (India) the largest the other way, 27th globally, but 96th by intensity.

This year’s special GII theme looks to the future of science-powered entrepreneurship
15. A deep science wave: more than 30,000 startups since 2000, now worth USD 7.6 trillion
Deep science ventures span life sciences, semiconductors, robotics, space, energy and advanced materials, turning frontier research into new firms and industries.
Drawing on the new Dealroom–WIPO Deep Science Startup Tracker – the first global mapping of deep science startups and spinouts – more than 30,000 deep science startups have been created since 2000, 9.5 times the 2010 figure representing about 16 percent compound growth a year. Their share of all venture-backed startups reached a 15-year high of 16 percent in 2025.
The field is concentrated at the top, but broadening at the base. The United States leads, with 12,752 firms, followed by China (3,466) and the United Kingdom (2,133); yet China grew 138 percent between 2020 and 2025 against 30 percent for the United States, Estonia grew fastest of all, and Türkiye, India and Malaysia lead the middle-income group (in order of growth).
Together these firms are worth USD 7.6 trillion, up 23 percent on 2024. Deep science attracted USD 122 billion in VC in 2025; excluding the USD 250+ million megadeals, that is 36.5 percent of global VC funding, nearly double the 2015 share, with the mix tilting from life sciences to semiconductors and robotics.
Universities are the key source of deep science entrepreneurship: over 40 percent of energy and life sciences ventures created since 2010 spin out of academic research, and US institutions such as Harvard, MIT and Stanford are behind 15 of the top 20 spinouts.

16. Patents anchor deep science ventures, and their use widens with maturity
With years between invention and first sales, patents are often the only verifiable asset a venture holds when securing financing, partnerships and licensing: 50 percent of deep science startups hold patents, against 15.4 percent of other startups; the gap has widened over the last decade. Medical devices and digital health is the most patent-intensive sector.
Patent use rises with maturity, from around 43 percent of ventures at seed stage to 69 percent at late stage; the Republic of Korea, Finland and Japan record the highest national rates. Patent leadership spans regions: East Asia’s 20 holders include 19 Chinese entities, led by ChangXin Memory, with 8,311 patent families.
Patent leadership is also emerging among middle-income economies: Malaysia’s Lemonex (49 patent families) and India’s Qure AI (37) lead, ahead of El Salvador’s Axonne (13), Brazil’s HiLab and South Africa’s LIQID Medical (10 each), with Egypt’s Mogassam and Kenya‘s Octavia Carbon topping national rankings.

17. Deep science takes root beyond leading hubs, but ventures stall at predictable transitions
Deep science is taking root beyond the leading hubs, from vaccines at the Serum Institute of India and Biovac in South Africa to BioNTech’s mRNA facility in Rwanda.
Yet R&D intensity sits below 0.5 percent of GDP in many low- and middle-income economies, and finance is thin: in Latin America, 72 percent of science-intensive startups stall at seed and only 19 percent reach Series A.
Even with record financing, ventures stall at predictable transitions: from research to investable proof-of-concept, from pilot to commercial deployment, and from working technology to profitable firm. Series B and C financing cliffs, regulatory friction, scarce talent and uncertain demand compound one another; industrialization rather than invention is now the binding constraint.
18. Policy priorities: finance the full translation stack and activate demand
Policy can raise the odds by financing the full translation stack and activating demand. Between research grants and private capital, ecosystems need proof-of-concept funding, pilot and demonstration facilities and later-stage patient capital, deployed through blended instruments such as matching funds, guarantees and first-loss tranches.
On the demand side, government procurement built on functional requirements, offtake commitments and anchor-customer programs turn breakthroughs into financeable projects. Equally important are the institutions around the science: professionalized technology transfer; shared labs, testbeds and certification pathways; regulatory sandboxes extended beyond fintech; and an intellectual property (IP) architecture of affordable filing, patent pools and IP-backed finance.
Translation talent completes the stack, including startup-leave provisions such as Tunisia’s Startup Act, under which employees can take up to two years leave to build a venture with a guaranteed right to return.
Policy should start from a diagnosis of where ventures stall and measure downstream outcomes such as follow-on investment, not program counts.
To conclude, the GII 2026 Special theme shows that the deep science wave is real and global, but its payoff is not assured: turning pilots into pipelines requires finance across stages, shared infrastructure, workable IP frameworks and translation talent.