
Topics covered in Part 5:
An overview of the top-down framework
Step 1: Methodologies used to establish the reasonable aggregate royalty rate
Step 2: Methodologies used to allocate the reasonable aggregate royalty rate to a specific portfolio
5.1 An overview of the top-down framework
The top-down framework can be used to estimate FRAND licensing terms for a disputed SEP license by:
identifying a reasonable aggregate royalty rate
(1)The term “aggregate royalty burden” is sometimes used interchangeably with “aggregate royalty rate”, but the terms are sometimes used to refer to different concepts: aggregate royalty burden meaning the actual amount that the licensee pays, and aggregate royalty rate referring to the whole stack of FRAND royalties charged by all licensors. This Report uses the term “rate” rather than “burden,” as it is addressing the hypothetical underpinning of the calculation. for the relevant standard (or set of standards) for a given product; andallocating an appropriate share of that aggregate amount to the licensor’s portfolio, based on the portfolio’s contribution to the standard.
Parties, courts and arbitration panels have used the top-down framework as a standalone valuation method for determining FRAND terms.
5.1.1 The rationale
Strictly, the top-down approach is not a single valuation methodology; it is a framework to which different inputs and analytical techniques may be applied. The framework has two core elements.
The reasonable aggregate royalty rate for the relevant standard. This is a benchmark for the total FRAND royalty that an implementer would reasonably agree to pay, in the relevant market and for the relevant product, for access to all patented technologies that are essential to practicing the standard.
The licensed SEP portfolio’s contribution to the relevant standard. This identifies the proportion of the aggregate royalty rate that the licensor is entitled to receive – i.e., its “share” of the reasonable aggregate royalty rate. It is typically proxied using evidence such as the number of relevant SEPs in its portfolio, adjusted for factors including essentiality, validity, infringement and technical importance, relative to all relevant SEPs.
Simplifying the practical considerations discussed below, Box 5.1 illustrates how two hypothetical parties may use the framework to inform a negotiation for cellular SEPs in smartphones.
SEP holder A and implementer B (the parties) negotiate a license for a portfolio of cellular SEPs (3G, 4G and 5G) in smartphones.
The reasonable aggregate royalty rate. The parties conclude, based on, for instance, the value to the implementer of the technical functionalities that the patented inventions enable, that a smartphone implementer would reasonably pay $40 per device – or 8% of a device’s $500 wholesale price – to license all SEPs essential to the 3G, 4G and 5G standards.
The licensed SEP portfolio’s contribution to the relevant standards. SEP holder A owns 10% of all declared patents essential to the relevant standards. After assessing the essentiality, validity, technical importance and geographic variation of the patent portfolio – relative to all relevant SEPs – SEP holder A and implementer B agree that the portfolio contributes 5% of the value of the standards.
Determination: The parties agree a royalty rate of $2.00 per unit for the license, reflecting SEP holder A’s share of the value enabled by the relevant standards (5% × $40 = $2).
Note: This box offers a simple, illustrative example to highlight the rationale for using a reasonable aggregate royalty rate benchmark to inform negotiations for cellular standard licenses. It is purely intended to illustrate the mechanics of the approach; it does not attempt to show the outcomes of real negotiations. It ignores practical considerations, both for establishing the benchmark and for allocation to portfolios due to differences in validity, essentially, technical importance or geographic differentiation – as discussed below and in Part 3, when considering the reasons why the value of different portfolios may vary.In principle, the appeal of establishing a reasonable aggregate royalty rate is that it anchors the analysis to what implementers seek to obtain: the functionality delivered by the standard as a whole, which is implemented through the combined use of many complementary patented technologies.
Using this anchor addresses the inherent difficulty of establishing how much an implementer would pay for the incremental benefit contributed by one SEP or by a portfolio of SEPs. The benefit can be difficult to isolate, particularly where each SEP-protected invention contributes only a minor part to a greater whole. For instance, in many cases, a standard’s core functionalities – such as data capacity, latency and power efficiency – may provide substantial value, but that value typically depends on many complementary contributions working together. Their value is therefore generated by the combination, rather than by any single SEP-protected invention alone.
By first establishing the value of the entire bundle of complementary SEPs, the top-down approach also seeks to mitigate the potential for royalty stacking. When complementary rights are licensed separately, then the sum of individually assessed royalties can exceed what an implementer would pay for access to the rights if they were licensed as a single complete bundle. By starting from an economically justified benchmark for the total value of the standardized technology, use of the top-down framework prevents that risk; starting at the “top” internalizes the complementarities. The aggregate amount is then allocated across SEP holders in proportion to their portfolio shares, ensuring that the aggregate royalty cost cannot add up to more than the sum of its parts.
Adopting an analogy using physical property, Box 5.2 illustrates the problem of royalty stacking when ownership is fragmented between multiple strictly complementary rights. The user – in this case, the tenant of an apartment – seeks to rent and values the entire property as a unified whole. However, when ownership is fragmented, the sum of uncoordinated bilateral negotiations with each “landlord” might not reflect the value of that property.
An apartment is owned by five independent landlords. A tenant is willing to pay $400 a week to rent the apartment, based on its facilities, the local amenities and transport links, and competition from other properties. Negotiations over rent can take one of two paths.
An uncoordinated approach, where each landlord values its claim independently. Without considering the aggregate cost, each landlord seeks $100, totaling $500 a week – an amount that exceeds the reasonable price for the benefits that the tenant actually receives and is willing to pay for.
A top-down approach, which, in contrast, takes $400 a week as the starting point and then asks what proportion of that rate each of the five landlords is entitled to, based on their relative stakes in ownership.
In practice, a top-down framework can provide several useful functions.
Greater clarity on the maximum potential costs of licensing. By establishing a maximum aggregate FRAND royalty for a given product market, the top-down framework addresses a principal concern of manufacturers: uncertainty about the maximum potential accounting cost of accessing the entire standard.
A broader range of use-cases. The framework may be applied where comparable licenses are scarce or unavailable – for example, where the parties are negotiating a license for emerging technologies or new product categories.
An independent cross-check. Even in established markets with comparable contracts, parties may dispute whether those agreements are FRAND – e.g., due to hold-up or hold-out.
(4)This was the case in Microsoft Corp. v. Motorola, Inc., No. C10-1823JLR (W.D. Wash., 2013) (link) , in which the court rejected various licenses because they did not provide a good indication of FRAND. For example, with respect to one license (covering certain SEPs), the court concluded that “there is no indication that [the parties] negotiated for the patents at issue […] under the RAND obligation” (para. 441). The court also cited potential “royalty stacking” issues with respect to Motorola’s demanded rate (para. 456, “Motorola’s royalty request […] raises significant stacking concerns”). The court ultimately decided that “the court must determine a reasonable royalty rate for Motorola's SEPs based on the principles underlying the RAND commitment, one of which is the concern of royalty stacking” (para. 460). A top-down analysis can serve as an independent benchmark against which the reasonableness of rates inferred from comparables can be tested.(5)Optis v. Apple [2025] EWCA Civ 552 (link) , paras 137–146; Unwired Planet v. Huawei [2017] EWHC 711 (Pat) (link) , para. 476.
5.1.2 The top-down framework’s two-directional approach
The framework can be applied in two directions:
a conventional (forward) application, to determine a FRAND royalty; and
a reverse application, to evaluate whether a proposed portfolio royalty implies a plausible aggregate royalty rate for the relevant standard.
5.1.2.1 The conventional (forward) top-down framework
In its conventional form, the framework aims to determine a FRAND royalty. It proceeds in two steps, detailed below.
Step 1: Establishing the reasonable aggregate royalty rate for all relevant SEPs.
(6)See Section 5.2 for methodologies. In this step, the parties establish a benchmark for how much an implementer would reasonably pay to license all SEPs for use in the relevant product.For instance, SEP holder A and implementer B may agree $40 per unit (or 8 percent of a phone with an average wholesale price of $500) to license all SEPs essential to cellular standards.
At this stage, the number and nature of SEPs are irrelevant. In principle, the value enabled by the standardized technologies is the same whether there are 10 genuine SEPs or 10,000. What matters is the collective value of all relevant SEPs for the enabled functionalities.
Step 2: Allocating a share of the reasonable aggregate royalty rate to the licensed SEP portfolio.
(7)See Section 5.3 for methodologies. The second step is to establish the proportion of the reasonable aggregate royalty rate that the SEP licensor is entitled to, based on the contribution that the specific SEP portfolio makes to the relevant standards (for example, 5 percent).
The reasonable royalty for a specific SEP portfolio
= reasonable aggregate royalty rate × portfolio’s contribution to the relevant standard
= $40 per unit × 5%
= $2 per unit
Note: This box offers a simple, illustrative example demonstrating a forward application of the top-down framework to determine a FRAND royalty rate. It is purely intended to illustrate the mechanics of the approach; it does not attempt to show the outcome of a real calculation.5.1.2.2 The reverse top-down framework
The reverse top-down framework applies the logic of the top-down approach, but as a consistency check for a proposed royalty for a specific SEP portfolio. Given the proposed royalty rate and the portfolio’s contribution to the relevant standards, the reverse approach asks whether the proposal, if generalized to all SEPs, implies an aggregate royalty that aligns with the benchmark for a reasonable aggregate royalty rate.
For instance, SEP holder A and implementer B negotiate a license for the use of A’s portfolio of cellular SEPs in B’s smartphones. Using, for example, the comparable contracts approach, A proposes that $3 per unit is a FRAND rate for its portfolio.
To assess that rate, they use the reverse top-down framework, applying the following steps (Box 5.4).
Step 1: Establishing the implied aggregate royalty rate. This step determines what the aggregate royalty rate would be if every SEP holder priced its portfolio in line with the royalty rate proposed for the Focal Contract. To do so, the parties take the proposed rate and scale it up by the licensed SEP portfolio’s contribution to the relevant standard – which, as above, they agree is 5 percent.
Step 2: Evaluating the implied aggregate royalty rate against a benchmark. That benchmark may be:
the reasonable aggregate royalty rate – which provided the starting point for the conventional top-down framework: e.g., $40 per unit; or
the total value that depends on the licensed technology – which reveals whether the implied aggregate royalty rate would leave implementers (and consumers) with a commercially reasonable share of that value: e.g., the parties estimate that $80 of the implementer’s product depends on the functionalities enabled by the licensed technology.
Here, the implied aggregate royalty rate is $60 per unit ($3 per unit divided by 5 percent).
In response, the parties may review the analysis underpinning the proposed rate, identify errors and revise it. Alternatively, they may apply the conventional top-down approach instead. The accuracy of the implied aggregate royalty rate will depend on how effectively differences in the average value of the portfolio per patent compared with all SEP have been accounted for (e.g., differences in average validity, essentiality, importance or geographic coverage). As discussed in Section 3.3.2 above, the implied aggregate royalty rate is sensitive to these issues, particularly for small SEP portfolios. As a result, caution should be exercised. The practical considerations are discussed in Section 5.3.2 below.
Establishing the implied aggregate royalty rate
The implied aggregate royalty rate
= rate proposed for SEP license ÷ SEP portfolio’s contribution to the relevant standard
= $3 per unit ÷ 5%
= $60 per unit
Evaluating the implied aggregate royalty rate
Against the reasonable aggregate royalty rate
= $60 per unit v. $40 per unit
= implied rate exceeds reasonable rate.Against the total value that depends on the licensed technology
= implied aggregate royalty rate ÷ total value that depends on technology
= $60 per unit ÷ $80 per unit
= proposed rate provides licensor with 75% of the value that depends on the technology
In both cases (1) and (2), the parties consider that $60 is too high and revise the estimate down.
Note: This box offers a simple, illustrative example demonstrating the application of a reasonable aggregate royalty rate benchmark to inform negotiations for a cellular standard license. It is purely intended to illustrate the mechanics of the approach; it does not attempt to show the outcome of real negotiations.5.1.3 Application in practice
The top-down framework has been considered by various parties, courts and arbitrators around the world to value licenses for SEPs – either directly or as a supplementary analysis to cross-check proposals based on other valuation methodologies. Some relevant examples are discussed below.
However, in practice, there is no single conventional approach that is used to estimate each of the framework’s two core elements: (i) the reasonable aggregate royalty rate and (ii) the relevant portfolio’s contribution to the standard. The specific methodologies used for each have varied, reflecting differences in the evidence available and how the relevant issues have been assessed in each case. The sections that follow outline the main approaches used for each element and discuss their respective strengths and limitations.
5.2 Step 1: Methodologies used to establish the reasonable aggregate royalty rate
The reasonable aggregate royalty rate for the relevant standard (or set of standards) is the conceptual foundation of the top-down framework. It represents a benchmark for the total royalty that an implementer would reasonably pay, in the relevant product market, for a license covering all SEPs essential to practicing the standard.
In practice, several methods have been used to estimate benchmarks for the reasonable aggregate royalty rate. We begin by distinguishing this conceptual benchmark from the aggregate accounting costs of the royalties that implementers actually pay. We then outline four approaches that have been applied or proposed to estimate the reasonable aggregate royalty rate:
licensors’ public statements about the likely aggregate royalty rate (where available);
the profit margin of the smallest saleable patent-practicing unit (SSPPU);
a proportion of the standard’s price premium in the relevant implementing device; and
a proportion of the product’s economic value that depends on the licensed technology.
Note that these approaches should not be considered as universally accepted methodologies. There are debates about their validity in principle and in practice, which are covered below. Rather, these are approaches that have been applied and proposed and may arise in negotiations and in litigation.
5.2.1 Disambiguation: the conceptual aggregate rate and the observed aggregate rate
In the top-down framework, the aggregate royalty rate is a benchmark for the total FRAND royalty associated with the functionalities collectively enabled by the SEPs. Conceptually, it estimates what an implementer would pay for licensing all the patented technology essential to a standard, if all SEPs were licensed on FRAND terms.
This conceptual aggregate royalty rate may differ from the observed aggregate royalty rate – that is, the aggregate royalties actually paid (see Box 5.5). Several factors contribute to the difference.
First, in practice, not all SEP holders actively seek cash royalties from all implementers.
Second, even where cash licenses are agreed, the royalties observed in those agreements might not coincide with the rate that would be determined under a FRAND assessment. Rates might be above or below a FRAND benchmark – either in aggregate or for particular portfolios.
Assume that the reasonable aggregate royalty rate to license all SEPs essential to standard X for use in product Y is $40 per unit.
SEP holders A to E hold all the SEPs of standard X, with the following shares:
A, B and C each hold 25% of the relevant SEPs
D holds 15%
E holds 10%.
A and B have already concluded licenses with the implementer at $10 per unit each. The implementer’s aggregate accounting cost for SEPs is now $20 per unit.
C and D do not actively seek licenses. This may be because they rely on cross-licensing, focus on product revenues or do not consider licensing commercially worthwhile. The implementer’s aggregate accounting cost for SEPs remains $20 per unit.
E now seeks to negotiate terms for a license. Under the top-down framework, its royalty is determined by its share of the conceptual reasonable aggregate royalty rate:
SEP holder E’s benchmark royalty = 10% × $40 = $4 per unit
Importantly, in a top-down analysis, royalties are assessed against the conceptual and reasonable aggregate royalty rates, not from “what remains” after deducting royalties already paid to other licensors. The fact that parties C and D have (so far) chosen not to enforce their rights is irrelevant.

5.2.2 SEP holders’ public statements on the likely aggregate royalty rate
Public statements by SEP holders about the aggregate royalty rate for a standard have been used as evidence when assessing FRAND terms. This section explains the rationale for relying on such statements, gives examples of their use in litigation and highlights practical and conceptual issues that arise in applying the approach.
5.2.2.1 The approach
In some disputes, courts and tribunals have considered public statements by SEP holders – for example, press releases, policy statements or “patent pledge” announcements – regarding the aggregate royalty rate they expected the relevant standard to attract. Where such statements exist, they can be used as evidence to establish a benchmark aggregate royalty rate for the standard, which is then allocated among SEP holders according to the assessed strength and share of their portfolios.
This approach has been used most often in the context of cellular standards, where major SEP holders have sometimes made public undertakings about aggregate royalties at or around the time when a new generation of technology is being promoted for adoption. Box 5.6 provides a hypothetical example of how it may be applied.
Two technologies compete ex ante to become the industry standard: technology A and technology B. Both incorporate patented technologies, owned by different firms.
Patent holders A to E own patents that protect the technologies essential to technology A.
Patent holders M to Q own patents that protect the technologies essential to technology B.
Before adoption, patent holders announce expected rates.
Patent holders A to E, collectively, announce that they expect the aggregate royalty rate for technology A to be a “single-digit percentage of the product price.” Patent holder A announces that it expects the rate to be 8%. Patent holder B announces the rate will be “no more than 10%.”
Patent holders M to Q make no announcement.
Implementers choose technology A, which becomes the market-wide standard. After adoption, the statements regarding technology A’s aggregate royalties are used as evidence of a reasonable aggregate royalty rate.
The reasonable aggregate royalty rate is considered to be 8–10%. In a subsequent negotiation, when the product is $500, the reasonable aggregate rate is set at $40–50, which is then allocated to the specific portfolio of SEPs.
Note: This box offers a simplified, hypothetical example illustrating relevant factors when considering the theoretical rationale for benchmarking the reasonable aggregate royalty rate to ex ante statements. It is purely intended to illustrate the mechanics of the approach; it does not attempt to show the outcome of real benchmarks.5.2.2.2 The rationale
The rationale for relying on SEP holders’ announcements is that, in some circumstances, they may reflect an ex ante competitive price – that is, a price free from hold-up. The idea is that SEP holders make these announcements before a standard is set or widely adopted – and therefore have an incentive to ask for lower royalties (in order to attract implementers).
In principle, the competitive pressure on announcements could take two forms, both of which lower the announced royalty.
Competition between alternative standards. Where implementers can credibly choose between rival technologies that are competing to become a standard, SEP holders may have incentives to signal that aggregate royalties will remain within a reasonable range in order to encourage adoption. This logic was discussed when valuing the 4G cellular standard, LTE, based on statements that SEP holders made when LTE faced competition from rival technology WiMAX. LTE became the global 4G cellular standard.
Absence of “lock-in,” even without a “head-to-head” rival. Even if there is no clearly defined rival standard, if implementers have not made irreversible investments, then SEP holders may still face pressure not to announce rates that could deter or delay adoption. The underlying idea is straightforward: if announced aggregate royalty rates are perceived to be excessive, implementers may delay adoption, reduce implementation scope, resist commercial rollout or look for alternative technical solutions.
The hope, therefore, is that these statements identify an aggregate royalty benchmark that approximates the rate what would be observed in an ex ante negotiation for all SEPs relevant to a standard, rather than the ex post rate determined when implementers are already locked in. Box 5.7 provides an overview of the approach in different jurisdictions.
Public statements regarding aggregate royalties have been treated as relevant evidence in several jurisdictions, including as part of top-down analyses or cross-checks.
United States: TCL v. Ericsson. The district court relied on public statements on the aggregate rate that the SEP holder expected for the 4G cellular standard LTE. The statements included references to “single-digit” aggregate levels and ranges such as “6–8%” of the implementing product’s selling price.
China: Huawei v. Samsung (Shenzhen), Huawei v. Conversant and OPPO v. Nokia (China’s Chongqing Intermediate Court). These follow the approach using SEP holder expectations to benchmark the reasonable aggregate royalty rate for LTE.
Japan: Apple v. Samsung (IP High Court, 2014). The court applied a calculation approach that incorporated an aggregate cap (reported as 5% for UMTS) when determining a FRAND royalty amount.
United Kingdom: Unwired Planet v. Huawei (2017). The court expressed reservations about relying on public statements, describing them as “obviously self-serving” – as a licensor could claim that the aggregate royalty rate would be low, but its own share was high. It highlighted internal inconsistency between them, and the difficulties of establishing a single rate that could be derived from those statements. Nonetheless, when applying a reverse top-down cross-check, the court noted that the statements were in line with its determination.
Note: This box offers a sample of public statements in FRAND cases from across four jurisdictions for illustrative purposes. This list is not exhaustive.5.2.2.3 Practical considerations when using SEP holders’ public statements to benchmark the aggregate rate
Where available, public statements can be informative, but their relevance is heavily dependent on the context within which they were made. Three issues arise:
practical issues in establishing a benchmark aggregate rate;
the extent to which expectations constitute a credible commitment (“promise to the market”); and
the extent to which a SEP holder’s business model affects the rates that it announces.
Practical issues in establishing a benchmark aggregate rate
The first practical consideration is that this approach is only available where sufficiently meaningful public statements exist, which is not always the case. Where such statements are made, they may reflect a range of considerations. In some circumstances, SEP holders may consider that announcing rates could encourage adoption of the technology in the standard-setting process, for example by signaling attractive licensing conditions relative to alternatives or by reducing concerns about high or uncertain licensing costs. Conversely, where standards face limited competitive pressure, SEP holders may have less reason to make such statements.
Practical factors can affect how easily statements can be translated into a reliable benchmark aggregate royalty rate for a specific standard and product. The following factors are particularly important.
Coverage. The reliability of the benchmark depends on the number of SEP holders announcing rates and the proportion of all SEPs that they cover. If many SEP holders, covering 80 percent of all SEPs, announce a rate, that is stronger evidence than if one SEP holder with only 1 percent of SEPs announces a rate.
Consistency. Where multiple SEP holders make announcements, the reliability of the benchmark depends on how consistent their statements are. Collective or consistent statements may carry greater weight. Divergent announcements require more interpretation and judgment on the part of the analyst.
Specificity. The reliability of the benchmark depends on whether statements clearly identify: (i) the relevant standard (or standard generation), (ii) the relevant product category (e.g., handsets versus infrastructure), and (iii) the precision of the rate announced. The more vague the statement, the less evidential weight it carries as it requires interpretation.
Where statements are numerous, specific and broadly consistent – and made by major SEP holders – they are more plausibly characterized as market-facing undertakings about aggregate licensing levels. Where they are sparse or vague, greater interpretation is needed and the approach becomes less robust. Box 5.8 illustrates and compares the two situations.
The table below shows this approach applied in two scenarios.
![[Box 5.8] Establishing aggregate royalty rates from public statements (Table)](https://datawrapper.dwcdn.net/0JREM/full.png)
In scenario 1, it is straightforward to establish a practical benchmark from the SEP holders’ joint announcement. The announcing SEP holders are numerous and represent the majority of SEPs, and their statements are specific and consistent.
In scenario 2, the approach is difficult to apply reliably. Only a few SEP holders make announcements, and they hold few of the relevant SEPs. The announcements are vague and inconsistent. Establishing a benchmark of the rate that would commit all SEP holders is practically difficult in this context.
The extent to which expectations constitute a credible commitment (“promise to the market”)
Another practical consideration is whether, in a given case, statements about aggregate royalties can be treated as a credible “promise to the market,” or merely as non-binding expectations.
This issue has been debated in both case law and policy. There are two related points.
Whether licensors’ statements regarding the aggregate royalty rate are reliable. Public statements may not always provide a stable indication of the royalty level that would ultimately be supported in licensing negotiations or litigation. For example, an SEP holder may endorse a relatively low aggregate level while also maintaining that its own portfolio accounts for a relatively large share of that total. This concern has been recognized in litigation.
(11)In Unwired Planet v. Huawei (link) , the court was concerned that licensors’ statements about the aggregate royalty rate were “self-serving” and inconsistent, and therefore unreliable. The issue was that each licensor only provided access to a subset of SEPs, so it could not be held to account against the aggregate royalty rate it had announced – each could claim that the rate was low, but also that their fair share of it was high. The judgment stated: “In my judgment the statements set out above have little value in arriving at a benchmark rate today for a number of reasons. The claims are obviously self-serving. The statements about aggregate royalties in particular are statements about other people’s money on the footing that the person making the statement says at the same time that the cake is quite small but they are entitled to a large piece of it. As an illustration, if one assumes Alcatel’s 2% royalty claim means they claim at least 20% of the Relevant SEPs (because in April 2008 Alcatel put their name to a “single digit percentage aggregate” and 2% is 20% of 10% (10% being just higher than the highest single digit percentage)) then the total shares of Relevant SEPs just mentioned in these statements add up to about 100% without including other major industry players such as Motorola, Qualcomm, and Samsung. The figures in Huawei’s own claim are not closely internally consistent either. A low single digit percentage aggregate sounds like a figure of no more than 5% but to produce that with a 15-20% share of Relevant SEPs represents a royalty of 0.75%-1%. To produce a royalty close to the 1.5% limit referred to requires an aggregate of 7.5%-10%.”, Unwired Planet International Ltd v Huawei Technologies Co Ltd [2017] EWHC 711 (Pat), para. 269. Whether aggregate royalty rates are binding or can be revised. Conventionally, implementers update their prices in response to changes in market conditions. Some SEP holders have argued that they too should be able to adjust their prices to reflect changing market conditions – for instance, if their assumptions about adoption rates, market sizes, product prices and the scope of use-cases prove to be inaccurate.
(12)TCL Communication Technology Holdings Ltd. v. Telefonaktiebolaget LM Ericsson, No. 8:14-cv-00341, (C.D. Cal. Dec. 21, 2017), amended and superseded (C.D. Cal. Sept. 14, 2018) (link) pp. 19–25, rev’d in part, vacated in part 943 F.3d 1360 (Fed. Cir. 2019) , cert. denied 141 S.Ct. 239 (2020). On this basis, the rates announced were merely expectations, not binding commitments.
However, with SEP licenses there is a dilemma. If announcements are not binding, that introduces the risk of ex post opportunism. The court in TCL v. Ericsson therefore treated the statements as commitments.
The extent to which a SEP holder’s business model affects announced rates
The final consideration is that a SEP holder’s business model may influence its incentives when making public statements.
Vertically integrated SEP holders. It has been argued that firms that are both licensors and implementers may be incentivized to endorse aggregate royalty levels that reflect both sides of the market – because they may pay, as well as receive, royalties.
The opposite has also been argued: because cross-licensing can reduce a vertically integrated firm’s exposure to high cash royalties, such firms may tolerate an aggregate royalty rate that imposes high cash costs on any rival that lacks its own SEP portfolio.
(16)If two vertically integrated SEP holders, A and B, cross-license to each other for a notional royalty of $x, then the cash cost for them is zero, as they each provide licenses of the same value. However, if a downstream competitor, C, has no SEPs, then it must pay the royalty in cash. If $x was a reasonable price, this is not an issue. However, the vertically integrated companies could set $x at any level, and pay no cash royalty. C, on the other hand, would be excluded. It has been argued that this was effectively the case in the Global System for Mobile Communications (GSM) era, and it helps to explain why all major implementers were vertically integrated SEP holders. For example, according to its leadership at the time, Sony agreed its Joint Venture with Ericsson as it had no SEPs of its own and could not afford the cash royalties, which it would avoid if it was in partnership with Ericsson. See Bekkers, R, B. Verspagen and J. Smits (2002). Intellectual property rights and standardization: The case of GSM. Telecommunications Policy, 26(3–4), 171–188; and Pringle, D. (2005). Dial time: Hidden asset could let Nokia capitalize on boom for 3G phones. The Wall Street Journal, March 10.
Non-practicing SEP holders. Firms that rely primarily on licensing revenues may face differ incentives again. Depending on context, they may seek higher royalties to maximize their licensing income. Alternatively, if adoption and scale are the central drivers of long-run returns, they may have incentives to support a reasonable aggregate level that promotes widespread adoption of the standard. An excessive rate may reduce both adoption and their expected overall revenue.
These practical considerations do not necessarily make public statements irrelevant. However, they underline why the valuation must examine who made the statement, when, under what competitive conditions and with what commercial incentives, before placing any weight on it.
5.2.3 The profit margin of the smallest saleable patent-practicing unit
This section describes an approach that uses the profit margin earned on the smallest saleable patent-practicing unit (SSPPU) as a reference point for the aggregate royalty rate. It uses the profit margin to indicate the value of the benefits that the licensed technology provides. There is significant disagreement about whether it offers a reliable benchmark for that value, in principle or in practice. This section first explains the motivation for the approach and how it may be applied, then sets out some practical considerations regarding its use.
5.2.3.1 The motivation for the approach
The aim of this approach is to isolate the value that is attributable to the licensed technology.
In complex downstream products, such as laptops or smartphones, their price and profitability reflect the contribution of many features and technologies. The price (or profit) earned on the consumer product therefore provides limited information about the incremental value attributable to any given functionality. For example, a manufacturer may sell a laptop for $800 and earn $100 profit, but it may be difficult to disentangle how much of that value is attributable to Wi-Fi, as opposed to processors, screens, operating systems, storage, industrial design or other features.
By contrast, the SSPPU-margin approach assumes that a chipset implementing the relevant functionality can provide a better reference point. The underlying assumption is that this upstream product’s price and profit is directly attributable to the value of the relevant technology. It further assumes that the chipset manufacturer’s profit on the unlicensed SSPPU represents the maximum amount that could be paid for a license before the chipset manufacturer would make a loss. On that view, the unlicensed profit margin functions as an upper bound for the reasonable aggregate royalty, after which the cost of the chipset (including the license) would exceed its price if the SSPPU manufacturer could not adjust its selling price.
5.2.3.2 Application of the approach
Under this approach, the aggregate royalty rate benchmark is inferred from the profit margin earned on the SSPPU – that is, the first separately traded product in the supply chain that implements the relevant standardized functionality. The SSPPU is typically a chipset that downstream manufacturers of consumer devices include in their products.
The approach treats the profit margin on the unlicensed SSPPU as an upper bound on the aggregate royalty rate for the relevant standardized functionality, on the assumption that the chipset manufacturer would fund the royalty out of its existing margin and could not (or would not) increase prices to reflect the license cost.
Box 5.9 sets out the key elements of the approach, and examples of its use are given in box 5.10.
For the relevant SEPs in the relevant product:
reasonable aggregate royalty rate = the profit margin on an unlicensed SSPPU
Assume that, for the relevant product category, downstream manufacturers purchase unlicensed Wi-Fi chipsets for $20 on average, and chipset manufacturers earn a 15% profit margin:
reasonable aggregate royalty rate for Wi-Fi SEPs in the relevant product category
= average SSPPU price × average SSPPU margin
= $20 × 15%
= $3
The $3 royalty sets the aggregate royalty rate for all SEPs, but that does not imply that licenses must be taken by SSPPU manufacturers. An SEP holder may license its technology at either the component level or consumer device level in the value chain, but the rate is the same.
Note: This box offers a simplified, illustrative example highlighting factors that may be relevant when considering the SSPPU benchmark in calculations of aggregate royalty rate. It is purely intended to illustrate the mechanics of the approach; it does not attempt to show the outcomes of real calculations.A US court adopted this approach in 2013. In In re Innovatio IP Ventures the court had to determine RAND royalties for patents asserted as essential to aspects of the 802.11 (Wi-Fi) standard, implemented in routers. It used the average profit margin earned on unlicensed Wi-Fi chipsets as a benchmark for the reasonable aggregate royalty rate for all Wi-Fi SEPs, reasoning that it revealed the maximum amount that implementers would be willing to pay. It then allocated the relevant patent holder its share of that rate, based on the strength of its portfolio.
The SSPPU-margin approach has been advanced in subsequent disputes but has not been accepted (in public decisions). In Optis v. Apple (UK High Court, 2023), the court considered an argument that the profit earned on a baseband chipset should be used as the reference point for a reasonable aggregate royalty rate for cellular SEPs implemented in smartphones. The court rejected that argument, describing its rationale as “wrong in its essence.”
5.2.3.3 Practical considerations when using the SSPPU to benchmark the aggregate royalty rate
The SSPPU-margin approach is contested because it depends on a fundamental assumption about pass-through. In particular, it assumes that chipset manufacturers would sell licensed chipsets at the same price as unlicensed chipsets, and could not pass any of the license cost through to downstream customers through higher prices.
This assumption is central because the unlicensed profit margin is treated as the point at which royalties would otherwise eliminate profit and push the chipset manufacturer into loss. If, however, the chipset manufacturer can adjust prices after taking a license – so that the selling price of the chipset reflects some or all of the license cost – then the unlicensed profit margin no longer constrains the royalty, and does not provide a stable benchmark for the value of the licensed technology.
Box 5.11 provides a simplified illustrative example comparing the impact that differing assumptions about pass-through may have on the approach.
An unlicensed SSPPU sells for $20, with a 15% profit margin: $3. The production cost is $17.
The profit margin is used to benchmark the reasonable aggregate royalty rate for Wi-Fi SEPs.
Scenario 1: A licensed SSPPU with no pass-through
The aggregate royalty rate is applied to the SSPPU, increasing “production” cost from $17 to $20.
The additional cost of the royalty is not passed on. The sales price remains $20.
The royalty cannot be any greater than $3, or the cost would exceed the price and the SSPPU manufacturer would incur a loss.
Scenario 2: A licensed SSPPU with full pass-through
The aggregate royalty rate is applied to the SSPPU, increasing “production” cost from $17 to $20.
The additional cost of the royalty is fully passed on. The price increases to $23, maintaining the SSPPU manufacturer’s unlicensed profit.
In principle, the royalty could have been higher or lower than $3. The profit was no constraint. Demand for the licensed chipset – taking its new costs and benefits into account – is sufficient to pass on the costs either way.

So, the key question is whether a chipset manufacturer, after taking a FRAND license that is equal to the entire profit on its unlicensed chipsets, would adjust its prices. There are two opposing views.
Manufacturers would not adjust SSPPU prices. Advocates of the SSPPU-margin cap assume that chipset manufacturers could not, or would not, increase chipset prices to reflect the license cost, so that royalties would largely be paid out of existing margins. This assumption underpinned the reasoning in Innovatio that the margin on the unlicensed SSPPU was, therefore, an upper bound on what an implementer would pay for a license.
(19) In re Innovatio IP Ventures, LLC, Patent Litigation, 921 F. Supp. 2d 903 (N.D. Ill. 2013) (link) p. 80, footnote 31. However, even on its own terms, this ceiling is highly stylized: in ordinary commercial negotiations, parties rarely agree to pay away the entirety of a product’s profit margin.Manufacturers would adjust SSPPU prices. Critics argue that, to the extent that competitive conditions allow, a chipset manufacturer would adjust its prices to reflect (i) any increase in costs or (ii) any increase in the value of selling a licensed component (as opposed to an unlicensed one). The licensed SSPPU would offer both: it includes the cost and benefit of a license, which otherwise an implementer must purchase separately. This was the essence of the criticism in Optis v. Apple, where the court reasoned that it was unsafe – in the absence of clear market evidence to the contrary – to assume that a chipset manufacturer would simply forgo profit rather than pass through at least part of the cost.
(20)See [2023] EWHC 1095 (Ch) , para. 218: “[t]here is no reason why the baseband chipset manufacturer would have to fund the licence fee to the stack out of the US$5 profit [that it earns on unlicensed chipset sales]. Indeed, it is quite absurd to presuppose that the manufacturer of a baseband chipset would forego any part of their profit unless absolutely compelled to do so. It is much more likely that baseband chipset manufacturers would increase the price of their product to reflect the added value to purchasers of that product of having a licence to the SEPs comprising the stack. Absent extremely clear market evidence, the assumption that the baseband chipset manufacturer would absorb the costs of the licence and not pass them on is almost certainly both unsafe and wrong.”
As a basic economic principle, manufacturers would adjust their prices and pass through FRAND licensing costs to the extent that competitive conditions allow. They would increase prices up to the point where their overall profits are maximized, given their higher costs after taking a license. However, they may not be able to pass through the entire cost: at some point, higher prices reduce sales sufficiently to outweigh the additional profit per unit. The precise amount passed through will depend on the intensity of competition and demand, among other factors.
5.2.4 A proportion of the standard’s price premium in the downstream consumer device
This section describes an approach that benchmarks the aggregate royalty rate using an estimate of the standard’s price premium in the relevant downstream product.
In principle, the price premium is the incremental price associated with products that implement the standardized functionality, controlling for other features and factors that also affect price. However, there can be significant disagreement about whether it provides a reliable benchmark in practice. This section first explains the motivation for the approach and how it may be applied, then sets out some practical considerations for its use.
5.2.4.1 The motivation for the approach
Like the SSPPU approach, this approach seeks to isolate the value that is attributable to the licensed technology. In doing so, it aims to address the same problem discussed above: the value of a complex downstream product, such as a laptop or smartphone, is affected by many features and technologies, not just the licensed technology. It may be difficult to disentangle the extent to which a product’s value is attributable to a specific technology, such as Wi-Fi, as opposed to other features and technologies it may have, such as its processor, screen, operating system, storage or industrial design.
Strictly, the price premium does not directly measure the value that the technology enables. It is a proxy for the value that the technology provides to the implementer: that is, the additional profit it earns, due to implementing the licensed technology.
Understanding a technology’s price premium
In principle, the price premium should isolate the impact that implementing the relevant standardized technology has on product price, controlling for differences in other features and factors that also affect price.
Box 5.12 illustrates a stylized comparison of average prices between two groups of products: one with the relevant standardized technology, and one without it – in this case, phones with 5G and phones with 4G. The difference between their average (wholesale) prices is large, but that is not attributable only to the standardized technology. The 5G phones also have greater screen resolution and more memory, which may also contribute to the price difference. Other differences, not shown in Box 5.12, may also help to explain the large price difference between the two groups of phones.
When launched, smartphones with 5G were priced substantially higher, on average, than products without 5G. However, they also differed in other respects. For instance, they typically had superior screen quality, memory and processing power. The observed price difference therefore cannot be attributed to 5G alone.
![[Box 5.12] Example of a price premium comparing prices without controlling for confounding factors (Table)](https://datawrapper.dwcdn.net/DpC6g/full.png)
In contrast, Box 5.13 illustrates the difference between the same groups of products, but this time controlling for all other differences. In this stylized example, the price difference is much lower than in Box 5.12. This is because, if controlled for adequately, the price difference is no longer affected by the differences in screen resolution and memory, which also, in this example, affect product prices. The intention, therefore, is that, if the impact that all confounding factors have on price is successfully controlled for, then the price premium should isolate the impact that the standardized technology has on the relevant products’ average price.
A price premium seeks to isolate the impact on price that depends on the relevant technology. In this case, that means comparing 5G devices to non-5G devices that are otherwise comparable in the characteristics that affect price (i.e., they have the same quality of screens, memory, processing power and so forth). In this illustrative example, 5G’s price premium over otherwise identical 4G phones is only 20%.

b. Using a technology’s price premium as a proxy for value to the implementer
This approach uses the price premium to approximate the value that licensed technology provides to an implementer. The rationale is that the licensed technology enables functionality that increases consumer demand for the implementer’s product. That increase in demand allows the implementer to sell more products and charge a higher price for them, reflecting the product’s greater attractiveness to consumers. So, in essence, the price premium captures the value of the benefit for which the implementer is paying.
Strictly, that value to the implementer is not measured by the incremental price alone, but by the incremental profit, taking into account changes in prices, costs and sales volumes. The price premium is therefore a proxy. In some cases, it can be refined; for example, by deducting incremental costs to estimate the profit per unit attributable to the licensed technology while controlling for other factors. Generally, the impact that the technology has on sales volumes is more difficult to incorporate. These issues are examined below, together with practical considerations.
5.2.4.2 Application of the approach
To establish a benchmark aggregate royalty rate, this approach applies two steps.
Step 1: Estimate the price premium empirically. Although the virtue of a price premium is relatively straightforward to understand in principle, it needs to be estimated accurately in practice.
Step 2: Split the price premium between innovators (collectively) and the implementer. As discussed in Section 1.1.2 above, the impact that technology has on the value of a product is not solely attributable to the technology, it depends jointly on the patented technology and the implementer’s product. Therefore, that value – which in this case is approximated by the price premium
(22)As discussed, the price premium seeks to measure the incremental impact that the technology has on price, which is a proxy for the value the technology provides to the implementer. Where possible, that proxy may be further refined before splitting it between the licensor and the implementer; for instance, by deducting incremental costs to estimate the incremental profit per unit that the technology generates. These refinements are discussed below, alongside other practical considerations. – is shared between the innovator and the implementer.
Step 1: Estimating a price premium
In practice, a price premium is estimated empirically. Two methods for estimation are presented here:
product matching; and
hedonic regression.
Estimating a price premium by product matching. This method identifies products that are closely comparable in all ways that affect their price except for implementation of the relevant standardized functionality – for example, two versions of a phone from the same model line, which are identical except that one offers 5G and the other offers 4G.
To illustrate this, Box 5.14 shows seven models of phone where (i) all the principal product features listed in the data are identical except the generation of cellular technology and (ii) each model had a 4G version and a 5G version. For each model, the 5G version of the phone has a higher price than the 4G version (22 percent on average). In principle, it should be possible to attribute these price differences to the 5G technology, as there are no other differences between the products.
However, two practical limitations arise.
Comparable pairs may be rare. Implementers often upgrade multiple attributes at once, so there may be few model “pairs” that differ only in the functionality of interest. Where pairs are sparse, it becomes harder to assess whether the observed price premium in those specific products is representative of the wider market. This is illustrated in Box 5.14, which shows that, out of 3.7 billion smartphones sales, only 13.8 million (0.4 percent) of those can be paired with a phone that is potentially an “otherwise identical model.” Of those, only seven models of phone are released with a 4G and 5G version.
Unobserved differences may remain. Two products may appear to be otherwise identical according to the information recorded in data and yet differ in unobserved ways that influence price. In other words, the data fails to capture all relevant factors that affect price. For example, the data may record features such as screen resolution and memory, but not regional band support, storage variants, bundled services, launch timing or differences in suppliers and associated costs. The more accurately all relevant attributes are captured in the data, the more confidently can the residual price difference be attributed to the standardized functionality.
For instance, consider Model 4 and Model 2 in Box 5.14. Assume that the 5G and 4G versions of Model 4 genuinely have no other differences in product features or external circumstances. As the 5G version sells for 19 percent more than the 4G version, we should be relatively confident that the price difference is attributable to 5G. However, now assume that, although the 5G and 4G versions of Model 2 appear to be identical on paper, in fact that they use different processors. That superior processor may explain, at least partially, why the 5G version sells for 28 percent more than the 4G version.
In the first five years after 5G phones were released, some smartphone companies released models with a 5G version and a 4G version.
![[Box 5.14] Illustrative example of product matching (Table)](https://datawrapper.dwcdn.net/1EbDl/full.png)
Estimating a price premium by hedonic regression. Regression is an econometric technique that uses information about characteristics to estimate relationships between them. Hedonic regression refers to a particular use of regression: it seeks to model the relationship between a product’s price and its observable attributes (e.g., brand, screen quality, memory, processor, launch date, region), including a variable indicating whether the product implements the relevant standardized functionality. The coefficient for that technology variable is interpreted as the estimated price premium associated with the functionality, holding the other included attributes constant.
The principle is simple. Each product is viewed as a bundle of the features it offers, each of which contributes to how well that product attracts consumers and the price it commands. By comparing the prices that different combinations of characteristics command, it is possible to build a model that reveals the contribution that each characteristic makes to the price of a product that offers it. Box 5.15 provides a stylized example explaining how a hedonic regression seeks to explain the different prices of four products by analyzing the variation in their prices and whether or not they offer four specific product features.
Four products are sold with a set of common features. Some also offer one or more of four optional features: A, B, C and D. Each optional feature adds functionality that attracts consumers to the core product and allows implementers to charge higher prices.
The table below shows the four products’ prices and features.
![[Box 5.15] Stylized example of hedonic regression (Table)](https://datawrapper.dwcdn.net/Q2jtY/full.png)
In its simplest form, regression expresses a relationship between the price of a product and the specified features. If a product has a particular feature, then it is assumed that that feature will have a particular impact on the product’s price.
The relationship between price and features is expressed by the “regression model,” for example:
log (pricei) = α0+α1 • Ai + α2 • Xi + εi
where the price (expressed as a logarithm) of any product, i, is given by:
a constant, α0, that applies to all products, regardless of the specific features;
the variable of interest, α1 • Ai, where the price of the product always increases by α1 when it has feature A, but by zero when it does not – for instance, feature A may be 5G;
variables for all other specified features – here, Xi represents a matrix of the other specified features that affect price, product features B, C and D – which, for instance, may cover features such as screen resolution or brand; and
εi is a term capturing the impact of unobserved product characteristics.
By comparing the different products’ prices and combinations of features, the model gives an estimate of the impact that each feature must have. In this case, it estimates that the common features contribute $500, and the optional features A to D contribute $50, $150, $20 and $60, respectively.
Note: This box offers a simple, hypothetical example of hedonic regression. It is purely intended to illustrate the mechanics of the approach; it does not attempt to show the prices of real products.In practice, applying hedonic regression well can be challenging. Hedonic regression is an established econometric technique, but – as with any empirical method – the reliability of its results depends on the underlying assumptions of the model, the quality of the data used and what modeling choices are made. It is not possible to comprehensively cover the relevant issues in detail here – they are technical and whether they apply in a particular case will depend on the particular facts and approach, and they are covered in standard statistical textbooks.
Omitted variable bias. This arises where the regression model excludes a factor that (i) affects price and (ii) is correlated with whether the product implements the standardized technology. In that situation, the estimated “technology premium” may partly reflect the omitted factor rather than the technology itself.
Example: Suppose most early 5G phones are also “flagship” devices with superior cameras and premium materials, but the dataset does not include variables capturing camera quality or materials. These features contribute to higher prices. However, that is not captured by the regression, as these features are omitted from the model of the relationship between price and product features. As such, the regression may attribute some of the price impact of the premium cameras and materials to 5G, thereby overstating the 5G premium.
Multicollinearity. This occurs where implementation of the standard is highly correlated with other variables (or with combinations of them) that are specified in the regression model. As these features tend to appear together, the model struggles to estimate the effect that each factor has on price in isolation. The result is often unstable coefficients and wide confidence intervals, even if the overall model “fits” prices well.
Example: Imagine that all 5G phones in the dataset have a superior processor to 4G phones. In this extreme example, the model cannot distinguish between the impact that 5G has on price and the impact that the processor has on price, as the two always appear together. The stronger the correlation, the greater the challenge.
Limited data or limited variation. Hedonic regression identifies the contribution of a feature by comparing products with different bundles of attributes. If there are too few observations, or if the data contain little meaningful variation in the relevant attributes, estimates become imprecise. A particular problem arises where the standard is almost always bundled with the same set of other features, leaving the model with few “comparisons” that isolate the technology.
Example: If, in the sample period, nearly all phones with 5G also have OLED screens and nearly all phones without 5G have LCD screens, there are few (or no) observations in which 5G varies independently of screen type. The model cannot reliably separate a 5G price premium from an OLED price premium.
The practical implication of these issues is that hedonic evidence requires robustness checks – for example, estimating the price premium under alternative model specifications (different control variables and functional forms), testing its sensitivity to different sample choices (time period, regions, price segments) and reporting confidence intervals. Greater confidence can be placed in results that remain broadly stable across a range of different plausible specifications.
Conceptually, there may be identification issues: that is, whether the coefficients of a hedonic regression do in fact capture preferences for the related component or if they actually capture something else. A general critique of hedonic regression is that the coefficients will reflect a combination of factors, including consumer preferences, but also competitive conditions and other factors. So, for example, the technology could be highly valuable, increasing consumer demand for the product, but in a highly competitive environment, implementers would not be able to increase prices and so the price premium would be small – largely reflecting incremental costs. Conversely, another component may add less value but be supplied by a monopolist, in which case its price premium would be higher. Below, we discuss how these conceptual issues affect the price premium’s use as an effective proxy for value.
Step 2: Split the price premium between innovators (collectively) and the implementer.
Regardless of how the price premium is estimated, it would not determine the reasonable aggregate royalty rate directly. As discussed in Section 1.1.2 above, that contribution depends jointly on the technology and the product – the value created by combining the innovator’s technology with the implementer’s product, complementary features and commercialization efforts. So, the price premium (after deducting incremental costs) is split between the implementer and the SEP holders. The proportion allocated to the SEP holders establishes the benchmark for the reasonable aggregate royalty rate. The proportion allocated to the implementer is its residual profit – the price premium minus the aggregate royalty rate.
How the price premium is split between the relevant SEP holders and the implementer can differ depending on whether the conventional (forward) top-down framework or the reverse top-down framework is used.
The conventional approach requires an explicit assumption or estimate regarding the proposed split. This can be challenging to substantiate. As discussed below, simple allocation rules – such as dividing the incremental benefit equally between the SEP holders and the implementer – without further justification have been dismissed by courts.
Alternatively, using the reverse top-down framework, the implied aggregate royalty rate for all SEPs can simply be compared to the price premium. The implied split between the SEP holders and the implementer can then be evaluated to assess whether it is reasonable – i.e., whether the amount of the price premium left for the implementer after deducting the implied aggregate royalty rate is reasonable.
5.2.4.3 Examples of hedonic regression in case law
While the hedonic regression approach has been accepted in some contexts, it has also been challenged by other courts. This emphasizes the importance of the practical considerations discussed below.
Some courts have used price premia, estimated by hedonic regression, to inform their decisions on FRAND disputes. For instance, China’s Nanjing Intermediate People’s Court in Huawei v. Conversant adopted a hedonic price model to estimate the value in the Chinese market of 3G mobile phones (12.5 percent) against the value in major developed countries (28.8 percent).
Some courts have rejected approaches that rely on hedonic regressions, but not because the empirical approach was invalid.
The UK High Court of Justice in InterDigital v. Lenovo considered evidence on the 3G, 4G and 5G price premia, which were estimated to be 26 percent, 21 percent and 21 percent, respectively. As shown in Box 5.16, the approach was rejected on procedural grounds. Generally, the evidence had not been presented at an early enough stage for the counterparty to properly consider its merits and respond. Specifically, the approach’s second step – which allocated the price premia equally between the implementer and licensor – had been insufficiently supported.
In the United States, the Court of Appeals for the Federal Circuit vacated the original ruling in VLSI Technology v. Intel. The court was presented with a “three-pronged” damages model, of which hedonic regression analysis was one of the prongs, used to estimate the specific price premium that consumers were willing to pay for microprocessor speed improvements attributable to the patented technology. The court vacated the award because the inputs used in the model were unreliable, and the apportionment of the price premium to the patented technology was poorly justified. The court explicitly stated that the regression methodology itself had not been persuasively shown to be improper or unreasonable.
In Stragent LLC v. Intel, the matter related to one of 19 “reliability, availability, and service” (RAS) features found in Intel microprocessors. The regression estimated that, collectively, they represented 42.0 percent of Intel’s average microprocessor selling price. However, they appeared together or not at all. For a hedonic regression to isolate the value of a single patented feature, it requires variation in that feature while holding others constant. The analysis, therefore, simply allocated the price premium equally between the technologies. The court considered that to be inadequate, ruling that the methodology had relied on arbitrary assumptions that have no basis in the facts of this case or hedonic analysis in general.
The claimant proposed reasonable aggregate royalty rates for 3G, 4G and 5G, based on the following.
Price premia. These estimated the incremental price attributable to licensed technology and were calculated using hedonic regression – expressed as a percentage of the relevant product’s average selling price.
A proposed split between the SEP holders and the implementer. In this case, it was proposed to split the price premium equally, on the basis that, “under very general conditions, economic equilibrium implies an equal division of the gains from trade if bargaining positions are symmetric,” experimental economic studies of bargaining on the meaning of “fair,” and that “many telecommunication firms are both implementers and innovators, and so must adopt the bargaining positions of both.”
The court rejected the approach presented to it, on the basis that the split between the implementer and SEP holders was a “critical step” that had, procedurally, not been properly pleaded and was insufficiently supported.
Estimates put forward in InterDigital v. Lenovo
![[Box 5.16] Estimates put forward in InterDigital v. Lenovo (Table)](https://datawrapper.dwcdn.net/092GQ/full.png)
5.2.4.4 Practical considerations
Even if the empirical estimation of the price premium is applied well and robustly, there are several other practical considerations that must be taken into account before the price premium can be used to establish a reliable benchmark. Here, we divide the key issues into two groups:
assessing whether the price premium can provide an adequate proxy for value;
assessing whether the price premium can be used to establish a benchmark for the reasonable aggregate royalty rate.
In both cases, there is disagreement about whether all the relevant issues can, in practice, be adequately addressed.
Using the price premium as a proxy for value
Even where the analysis gives a reliable estimate, the price premium has several limitations as a proxy for the incremental value to the implementer’s product that can be attributed to the licensed technology.
Using the price premium to assess incremental profit per unit. A price premium measures incremental impact on the product’s price that is attributable to the technology. However, the licensed technology may also increase the implementer’s production costs (for example, where required components are more expensive). Ignoring such cost increases would therefore overstate the value that the technology provides to each product.
It may be possible to refine the price premium as a proxy for value, by deducting incremental costs. That, in principle, would provide a better metric: the incremental profit per unit that is attributable to the technology, controlling for other factors.
For instance, if the price premium is estimated at $80, and the relevant chipsets cost $10 more than those used in the previous generation, the incremental profit per unit would be $70. In this example, part of the observed price premium reflects higher input costs, rather than an increase in the implementer’s profit per unit.
A further complication may arise where the hedonic regression relies on retail prices. Retail prices incorporate the margins of downstream distributors. Where possible, the price premium should instead reflect the incremental impact on wholesale prices.
Using the price premium only captures the benefit per unit, not the impact on product sales. The price premium focuses on the impact that the licensed technology has on price per unit. It does not capture any effect on total sales volumes arising from the technology. Where standardized technology increases consumer demand, this will typically affect both the price of the product (the “price premium”) and the number of units sold (a “quantity premium”), each measured relative to the counterfactual without the technology.
However, both effects can benefit the implementer, increasing its profits. For example, the technology may increase demand such that the implementer can charge prices that are 20 percent higher and sell 10 percent more units than for an otherwise identical product without the technology.
Excluding the impact on sales is an imperfection of this approach.
Using the price premium only seeks to measure the value to implementers, not to consumers. A price premium is calculated from market prices and therefore reflects the portion of value that implementers can monetize through higher prices. It does not capture the additional value that consumers may enjoy (consumer surplus) from superior products. This limitation can be particularly important in competitive markets, where implementers may have limited ability to increase prices, even when consumers value the functionality enabled by the licensed technology highly.
For example, a technology may enable features that consumers value and increase demand. However, intense competition between implementers may keep prices relatively low: close to their marginal costs. In this situation, consumers benefit: sales increase, due to the additional consumer demand, but the price premium is modest. In this scenario, the low price premium does not, however, imply that the functionality generates only modest value. Consumers have a high willingness to pay for the benefits they receive. Rather, it reflects competitive constraints on price, such that consumers, not implementers, capture more of the value that the technology enables in the product.
In some cases, it may be possible to address these limitations directly; for example, by adjusting the price premium to account for an increase in incremental costs. In some cases, it may not be possible.
In all cases, these limitations mean that price premium evidence must be interpreted with care. For instance, a low price premium leads to different conclusions in different competitive circumstances. In some markets, a low premium may understate the total value enabled by the standardized functionality, and additional evidence (e.g., on demand responses, substitution patterns or willingness-to-pay) may be needed to assess whether the implied aggregate royalty rate is proportionate. In others, a low price premium may reveal that the technology provides modest benefits.
Using the price premium to benchmark the reasonable aggregate royalty rate
Where a price premium has been estimated (and adjusted for incremental costs), a further step is required to translate that evidence into a reasonable aggregate royalty rate.
The central question is how the remaining gains associated with the standardized functionality should be divided between (i) SEP holders (through royalties) and (ii) implementers (through residual profit).
From an economic perspective, the main considerations for assessing an appropriate split are as follows.
The price premium measures value ex post, not incremental value over the next-best ex ante alternative technology. A price premium seeks to measure the value of having the functionality compared with not having it. That is not necessarily the same as the incremental value of the technology relative to the next-best technology or technical option that could have been adopted.
For example, assume that the premium associated with implementing LTE in Product X is $100 relative to “no 4G functionality.” If a plausible alternative standard (e.g., WiMAX) would have produced a price premium of $80, then the incremental advantage of LTE over that next-best alternative is $20. In principle, that incremental value may be a relevant benchmark for the reasonable aggregate royalty rate. In practice, it cannot be measured empirically.
The significance is that, all other things being equal, the more valuable the ex ante alternative was (relative to the technology that was actually implemented in practice), the lower the innovator’s share of the price premium would be, and the greater the implementer’s share would be.
The aggregate royalty rate must provide both sides with ex ante incentives to participate. Any split should leave both sides better off, viewed from an ex ante perspective (i.e., it should not assume that either side will accept terms that would have caused them to walk away if they were not already locked into the standard).
For example, if a proposed allocation assigns SEP holders nearly all the price premium (after deducting costs), implementers would have lacked ex ante incentives to invest in development, implementation and product commercialization. Conversely, if implementers retain nearly all of the price premium, then innovators may have lacked ex ante incentives relative to the risks and costs of contributing technology that becomes essential.
Balancing parties’ incentives does not necessarily require equal reward. Equally valuable contributions warrant equal reward. Each side of an SEP negotiation incurs some risk to contribute to the value that their contributions enable. In economic terms, this cooperative effort creates a “double-sided moral hazard” problem, which leads to the following dilemma: the greater one side’s own share of the reward, the more likely that side is to take the risk to compete, contribute and benefit; but the smaller the other side’s share, the less likely that side is to compete and contribute, which then constrains the size of the pie that the side with the lion’s share enjoys. In these circumstances, when the contribution made and risk incurred on each side is equal, both sides will benefit most when they agree to an equal split of the value that their cooperation generates.
However, contributions are not necessarily equal. Balancing incentives between innovators and implementers, in principle, should recognize that. A party may reasonably claim a greater proportion of the price premium where an asymmetric allocation of returns is necessary to:
incentivize it to contribute and take on greater risk that the counterparty faces (for example, because the counterparty’s contributions may be relatively cheaper or easier, or many other firms may offer competitive solutions); and
incentivize implementation of complementary technologies in products – the value attributable to implementing a standardized technology may overlap with the value attributable to implementing other complementary technologies. In these cases, implementers need some incentive to combine technologies where that would benefit consumers.
These issues require consideration whenever a price premium is used in the top-down framework. However, the application differs depending on which approach is being used. In a forward top-down analysis, an explicit allocation rule is needed to convert a price premium into a reasonable aggregate royalty rate. In a reverse top-down analysis, precise apportionment may not be necessary: the price premium can be used as a sense-check against an implied aggregate royalty rate, to test whether the implied total royalties appear proportionate to the estimated incremental benefits associated with the standardized functionality.
5.2.5 A proportion of the product’s economic value that depends on the licensed technology
This approach seeks to estimate the total economic value of all incremental benefits that depend on the licensed technology. It aims to capture not only the impact that the technology has on prices, but also its effect on sales volumes and on consumer surplus – the benefit that consumers receive beyond the price they paid.
In this section, this is referred to as an “economic value added” approach. It is a counterfactual market analysis that compares outcomes in a market with the relevant licensed technology with outcomes in a market without it, and uses that comparison to inform an aggregate royalty rate benchmark.
5.2.5.1 The motivation
This approach has been proposed because it seeks to estimate the full economic value of the benefits that depend on the licensed technology for all parties, including consumers, and to model how different royalties would affect market outcomes.
The particular aims of the approach are as follows.
Capture benefits to both implementers and consumers. Unlike a price premium alone, this approach seeks to account for the effects of the technology on demand, consumer surplus and implementers’ sales volumes.
Assess incremental costs and pass-through. The approach can accommodate incremental production costs associated with the technology and estimate how royalties (as a cost increase) may be reflected in prices and quantities under the competitive conditions assumed.
Support incentive analysis. By showing how different royalty levels change the distribution of value, the model can help to assess whether proposed aggregate royalty rates plausibly preserve ex ante incentives for contributions to both innovation (development and participation in standardization) and implementation (product development and commercialization).
As a counterfactual market analysis, the approach is conceptually similar to modeling techniques used in other contexts, such as merger simulations used by competition authorities to assess the potential impact of proposed mergers on consumer welfare and market competitiveness. In both use-cases, the focus is on the incremental effects – whether from the presence of the licensed technology or from a merger – on market dynamics.
5.2.5.2 The approach
The economic value added approach compares the total economic value in a product market with and without the benefits and costs of the licensed technology. This comparison reveals the extent to which the licensed technology benefits consumers, implementers and licensors by accounting for its effect on demand, prices, quantities and costs – including royalty payments.
The analysis is grounded in an economic model of the relevant market. It has four core steps:
Step 1: Specify and calibrate the model of the relevant market (the factual scenario). An economic model is calibrated to replicate the outcomes in the market – prices, sales volumes, costs and competitive intensity between implementers.
Step 2: Construct counterfactual scenarios, with and without the licensed technology. The factual scenario is then adjusted to estimate how outcomes would differ under two counterfactual settings:
a scenario in which all products reflect both the costs and the benefits of the licensed technology; and
a scenario in which no products have either those costs or benefits.
Step 3: Measure changes in outcomes and total economic value. The comparison estimates how the technology affects demand, prices, quantities and costs, and therefore how the value that depends on the licensed technology is distributed between:
licensors, through incremental royalty income;
implementers, through incremental profits; and
consumers, through incremental surplus.
Step 4: Assess how counterfactual royalty rates impact outcomes. Unlike the price premium analysis, the model can be used to assess how different aggregate royalty rates would affect prices, sales volumes and the division of value between parties, including the extent of cost pass-through.
Box 5.17 illustrates the economic value of a product market with and without the costs and benefits of the licensed standardized technology. The illustration is intended for readers familiar with basic microeconomic concepts, such as demand curves and consumer and producer surplus.
This example illustrates the value of a product market when it implements a licensed technology (shown in red) and when it has neither the benefits nor the costs of that technology (shown in green). The key building blocks are as follows:
Consumers value the product more with the technology. When the product includes the licensed technology, it offers better or additional features. As a result, consumers are willing to pay more for it. In the chart, this is shown by higher demand (dt) compared to demand without the technology (dx). The sloping lines represent the distribution of how much different consumers are willing to pay.
Prices and sales are higher with the technology. Because demand is stronger, manufacturers can charge higher prices and sell more units. These are shown in the chart as p (price) and q (quantity). The difference between the two scenarios reflects the additional sales and higher prices that depend on the technology. The size of this effect depends on how much demand increases, how much production costs (c) rise and how competitive the market is.
The overall market is more valuable. The shaded areas in the chart show that the total economic value of the market is higher when the technology is included. They also illustrate how this extra value is shared between consumers, manufacturers and SEP holders.
Assessing how different royalty rates would affect value. Manufacturers must pay royalties (rt) to use the standardized technology, which adds to their costs. The model can be used to assess how different royalty levels affect the total value of the market and how that value is divided between the different groups.
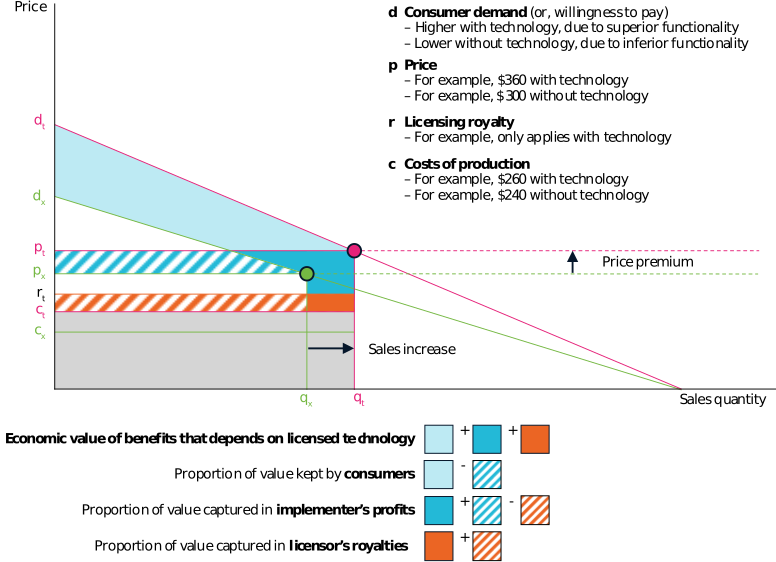 Note: This box offers a simplified, hypothetical example to illustrate relevant factors when considering a market’s economic value with and without costs and benefits of the focal licensed technology. It is purely intended to illustrate the impact of a given licensed technology; it does not attempt to show the dynamics of a real market.
5.2.5.3 Practical considerations when using the economic value added approach to estimate reasonable royalties
Assessing the reliability of the modeling
As with any model-based approach, reliability depends on the model’s structure, assumptions and data.
Model sophistication can vary. The economic model may be highly detailed, capturing product-specific supply and demand relationships, competitive intensity and pricing dynamics. Alternatively, it can be a simplified representation of the market that still reflects the key relationships between prices, quantities and outcomes for producers and consumers. In either case, the model enables an equilibrium analysis that shows how the licensed technology affects product market prices and quantities, and thereby firm profits and consumer surplus (i.e., including all the benefits, monetary and non-monetary, that consumers get from the product).
Simplifying assumptions should be assessed against the purpose of the model. Modeling will often involve simplifying assumptions. Common simplifications include treating the market as a single “average product,” imposing linear demand or assuming a particular competitive structure. Simplification reduces data requirements and can make results more transparent, but it may also omit important features, such as product differentiation. The principal issue is whether the simplifications materially affect the conclusion for the relevant analysis – for example, bounding a reasonable aggregate royalty rate or testing whether an implied aggregate royalty rate is proportionate.
Calibration requires data (or justified substitutes). Data requirements depend on the complexity of the model, but may include prices, quantities, cost structures, margins, market shares and measures of the technology’s effect on demand, which, for instance, may be informed by price-premium evidence. Where the technology has not yet been widely deployed, historical market data may be lacking or irrelevant – particularly in the case of disruptive innovations. In such instances, survey-based demand estimation can serve as a viable alternative. This method is used in merger control and new product pricing, and in evaluations of intangible or non-market benefits, such as sustainability impacts.
Using the model to determine a reasonable aggregate royalty rate
As with the price-premium approach, the economic value added approach does not, by itself, dictate a unique aggregate royalty rate. A royalty benchmark still requires a judgment about how the incremental value created by the technology should be shared between licensors and implementers.
In principle, the same considerations apply: terms should preserve ex ante incentives on both sides; the division of value should reflect relative contributions and risks; and implementers generally require sufficient residual return to support investment in product design, integration and commercialization, including in complementary innovations that increase the technology’s realized value.
The approach is also well-suited to reverse top-down analysis. Because it can translate an implied aggregate royalty rate into predicted effects on prices, quantities, implementer profits and consumer surplus, it can help to evaluate whether an implied aggregate rate appears disproportionate relative to the benefits that depend on the technology under plausible market conditions.
5.3 Step 2: Methodologies used to allocate the reasonable aggregate royalty rate to a specific portfolio
After establishing a reasonable aggregate royalty rate for the relevant standard (or set of standards), the top-down framework allocates a share of that aggregate rate to the particular SEP portfolio being licensed. The aim is to estimate the portfolio’s relative contribution to the standard, compared with all SEPs that contribute to it. As already illustrated, the licensor’s contribution may differ from its proportion of declared SEPs. If the proportion of its portfolio that is essential, valid, infringed and technically important is less than for all SEPs on average, its contribution will be less. If the proportion is greater than average, its contribution will be greater too. Differences in where the licensee sells or manufactures its device can also be assessed and accounted for, as discussed below.
This section sets out the basic allocation approach and the main considerations when applying it in practice.
5.3.1 The approach to allocation
The baseline approach allocates a licensor’s share of the aggregate royalty rate in proportion to its SEP portfolio’s share of the total SEP “stack”. The allocation starts from an average value assumption, before considering refinements for observable differences between portfolios.
5.3.1.1 Baseline allocation: patent counting or share of the stack
The simplest approach – often described as “patent counting” – allocates a licensor’s share of the aggregate royalty rate in proportion to the size of its SEP portfolio relative to the total SEP “stack” for the standard (see Box 5.18).
This approach does not require the assumption that every patent has identical value. Rather, it relies on an average value assumption, which is that, absent evidence to the contrary, the average value of the licensor’s SEPs is broadly similar to the average value of all SEPs in the stack – based on their essentially, strength and technical importance.
5.3.1.2 Refining the baseline
In practice, parties may seek to refine the average value assumption by adjusting for observable differences between portfolios that may systematically affect their value. The practical considerations are summarized below.
SEP holder A and implementer B negotiate terms for a license covering SEPs essential to standard S, for use in product X. They have determined that a reasonable aggregate royalty rate is $40 per unit.
Portfolio’s reasonable aggregate royalty rate
= reasonable aggregate royalty rate × portfolio’s contribution to the standard
Allocation by patent counting
SEP holder A owns 5% of all declared SEPs. So, on a simple allocation, it receives 5% of the reasonable aggregate royalty rate: $2 (5% × $40).
![[Box 5.18-1] Allocation by patent counting (Table)](https://datawrapper.dwcdn.net/IHfCq/full.png)
The average value assumption
Not all of SEP holder A’s declared SEPs are essential, valid, infringed or technically important. However, that does not affect its allocation if the proportion of its SEPs that are essential, valid, infringed and technically important reflects the rates that apply to all SEPs. The assumption, therefore, is that, on average, its declared SEPs contribute to the standard’s value in the same proportion as all declared SEPs.
To illustrate, assume that for both SEP holder A’s portfolio and the stack of all SEPs, 20% are essential and 50% are valid. There are 10,000 SEPs that are valid and essential; the reasonable aggregate royalty rate for these SEPs is still $40 (as the non-essential, invalid patents do not contribute to that value). SEP holder A owns 5% of the valid and essential SEPs, so it still receives 5% of the reasonable aggregate royalty rate: $2 per unit.
![[Box 5.18-2] Allocating a reasonable aggregate royalty rate to a portfolio (Table)](https://datawrapper.dwcdn.net/H7hiD/full.png)
5.3.2 Practical considerations
When refining the average value assumption, differences can arise between the average quality of a specific portfolio and the average quality of all declared SEPs. These can occur for several reasons, the most frequently cited being differences in the proportion of declared SEPs that are:
truly essential (as opposed to merely declared);
infringed;
valid (or likely to be held to be valid if tested);
technically important to the relevant products; and
relevant to the license scope, including the jurisdictions where products are sold and where patent rights can be enforced.
5.3.2.1 Differences in essentiality
Not all declared SEPs are ultimately found to be, in fact, essential. Standards bodies generally encourage participants to declare any patents that may be essential, to reduce the risk that an undisclosed patent later “blocks” implementation of the standard. The pool of declared SEPs is typically larger than the set of patents that would be found essential on closer analysis.
A licensor’s share of declared SEPs therefore does not necessarily correspond to its share of SEPs that would be found essential on closer analysis. In the top-down framework, that licensor’s share of the aggregate royalty rate should reflect its share of all genuinely essential SEPs. Therefore, if a licensor’s portfolio has a higher-than-average rate of declared SEPs that are truly essential, its share of the aggregate royalty rate would increase relative to the share based on its share of declared SEPs. If its essentiality rate is below average, its share would decrease. See for example, TCL Communication Technology Holdings Ltd. v. Telefonaktiebolaget LM Ericsson, No. 8:14-cv-00341, (C.D. Cal. Dec. 21, 2017), amended and superseded (C.D. Cal. Sept. 14, 2018) (link) , rev’d in part, vacated in part 943 F.3d 1360 (Fed. Cir. 2019) , cert. denied 141 S.Ct. 239 (2020).
Several issues have arisen in the assessment of essentiality rates.
5.3.2.2 Differences in infringement
SEPs may not be infringed, even in products that comply with the standard. Some SEP-protected functionalities are not mandatory, so a product may simply avoid infringing the patents. Others may apply to some products but not others. For example, technology that is mandatory in standard-compliant infrastructure may not be relevant to smartphones or other terminals that connect to that infrastructure.
As a result, a licensor that holds 5 percent of declared SEPs does not necessarily hold 5 percent of SEPs that are genuinely infringed. If the licensor has a higher-than-average proportion of non-mandatory SEPs, and the licensor does not implement those non-mandatory features, then its share of the aggregate rate would be adjusted down accordingly.
5.3.2.3 Differences in patent validity
In a given patent portfolio, some patents will be valid and others will not. Patents that have been proven to be invalid have no value. Patents proven to be valid command their full value. This means that a patent’s value prior to a validity assessment is probabilistic (i.e., between zero and its full value, based on the likelihood that it would be proven valid if assessed).
In principle, as with essentiality, the issue is that the proportion of valid patents varies between portfolios, such that some may be stronger than all SEPs on average, and some may be weaker. If a licensor’s portfolio has a higher than average rate of declared SEPs that are valid (or likely to be held to be valid), then its share of the aggregate royalty rate would increase relative to the share based on its share of declared SEPs. If its rate is below average, its share would decrease.
In practice, however, some courts are cautious about attempting to make portfolio-level validity comparisons using broad metrics. In Optis v. Apple, for example, the court stressed the fragility of assuming “better than average” validity in the absence of reliable evidence and noted that assessing validity across a large stack is “extremely unsafe.”
5.3.2.4 Differences in importance of SEP-protected invention for the technology standard
Even among patents that are both valid and standard essential, not all inventions are equally significant. Some SEPs protect inventions that are central to the standard’s core functionality, while others do not. Portfolios may therefore differ substantially in average value depending on the importance of the SEP-protected inventions for the technology standard they cover.
It can be difficult to control for differences in importance of SEP-protected inventions for the technology standard in a reliable way. Broadly, assessments fall into two categories:
Qualitative. Portfolios can be assessed as “important” or “moderately important” through expert testimony regarding the technology’s functionality and available alternatives prior to standardization. Where the justification provided for those classifications is insufficient, courts have rejected them.
(38)TCL Communication Technology Holdings Ltd. v. Telefonaktiebolaget LM Ericsson, No. 8:14-cv-00341, (C.D. Cal. Dec. 21, 2017, amended and superseded (C.D. Cal. Sept. 14, 2018 (link) ), rev’d in part, vacated in part 943 F.3d 1360 (Fed. Cir. 2019) , cert. denied 141 S.Ct. 239 (2020). Also, for instance, “this court has determined that Innovatio's patent portfolio is of moderate to moderate-high importance to the 802.11 standard”, In re Innovatio IP Ventures, LLC, Patent Litigation, 921 F. Supp. 2d 903 (N.D. Ill. 2013), (link) p. 71. Quantitative. Some quantitative metrics are correlated with patent value, so potentially these can be used to assess variation in value between portfolios. For instance, the academic literature has used “patent citations” – the citations that a patent receives from subsequent patents – to indicate a patent’s influence on subsequent innovations.
(39)Trajtenberg, M. (1990). A penny for your quotes: Patent citations and the value of innovations. The Rand Journal of Economics, 21(1), 172–187; Sampat, B.N. and A.A. Ziedonis (2004). Patent citations and the economic value of patents. In Moed, H.F., W. Glänzel and U. Schmock (eds), Handbook of Quantitative Science and Technology Research. Dordrecht: Kluwer, 277–298; Harhoff, D., F. Narin, F.M. Scherer and K. Vopel (1999). Citation frequency and the value of patented inventions. Review of Economics and Statistics, 81(3), 511–515. Academic literature has found that forward citations are correlated with patent value.(40)Trajtenberg, M. (1990). A penny for your quotes: Patent citations and the value of innovations. The RAND Journal of Economics, 21(1), 172–187. Courts tend not to rely on such metrics, particularly where the correlation is loose or explains only a small percentage of the variation in patent value.(41)Harhoff, D., F. Narin, F.M. Scherer and K. Vopel (1999). Citation frequency and the value of patented inventions. The Review of Economics Statistics, 81(3), 511–515.
A further complication with assessment of the importance of SEP-protected inventions for the technology standard is complementarity. The technical importance of a particular invention protected by a single SEP may be difficult to isolate from the value it creates in combination with other related SEP-protected inventions. As such, in practice, technical importance tends to be considered for broad groups of patents that all contribute to a related area or part of the standard, not for individual patents
5.3.2.5 Differences in exposure to relevant patent jurisdictions
As discussed in Part 3 on valuation from comparable contracts, the value of a portfolio can depend on (i) where the licensee sells products and (ii) where the licensor holds enforceable patent rights.
Because the reasonable aggregate royalty rate is often framed as a benchmark for a global license, a top-down allocation may, where justified by evidence, take account of whether a particular portfolio (or licensee) has materially greater than average exposure to regions where effective rates are systematically lower – for instance, due to weak patent coverage in that region, enforcement or market conditions.
Judge Selna used this approach in TCL v. Ericsson
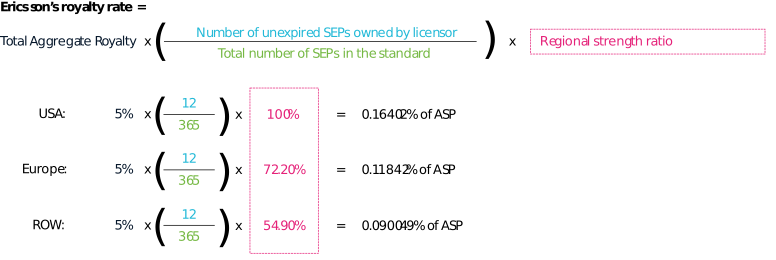
The approach in TCL v. Ericsson reflected the significant variation in Ericsson’s portfolio strength across the key markets where TCL sold and manufactured its products. The court began by assessing a FRAND rate for Ericsson’s US portfolio, where Ericsson’s portfolio was largest. Taking 2G as an example, and recognizing that Ericsson’s portfolio was weaker in Europe, the court applied a downward adjustment such that the rate for Europe was 72.2 percent of the US rate. For devices sold in the rest of the world, the court applied a downward adjustment to 54.9 percent of the US rate, which was based on Ericsson’s portfolio strength in China. The court assessed these “regional strength ratios” by taking into account those technologies which fell in the public domain, whether because they had expired or because they were unpatented in a particular jurisdiction.
Theoretically, a licensor may choose to collect royalties for an individual product either in the country of manufacture or in the country of sale, and it would in principle choose the country where its portfolio is stronger. There are, however, additional considerations. First, as a general economic principle, patents which are held in the location of manufacture may be less valuable than the location of sale (where the value of the product is realized), for example because it may be easier for the implementer to move its place of manufacturing than to alter the composition of its market segment of end users. Second, because TCL manufactured exclusively in China, implementing a manufacturing floor was relatively straightforward. In cases where an implementer manufactures across a wider range of countries, including those where the SEP holder’s portfolio is not particularly strong, then accounting for a manufacturing floor requires a more detailed assessment to correctly reflect the value of the underlying rights.
5.4 Summary
The top-down framework offers a structured way to estimate FRAND terms by anchoring valuation in a reasonable aggregate royalty rate for the standardized technology as a whole and then allocating that total among SEP holders according to their relative contributions.
As this part has shown, both steps are feasible in principle, but they both depend heavily on evidence and assumptions:
benchmarks for the reasonable aggregate royalty rate for all SEPs may be inferred from public statements, component-level economics, price premia or broader market-value models; and
a particular SEP portfolio’s share of that aggregate royalty rate is typically proxied, using patent counts that are refined (where reliable evidence permits) depending on the portfolio’s essentiality, validity, infringement, technical importance and geographic scope compared with all declared SEPs.
In practice, the framework is therefore often used both as an independent valuation method and as a cross-check on results derived from other valuation methods, such as comparable licenses.