Key numbers for 2024
9,455 (+10.3%) International applications
8,847 (+5.7%) International registrations
43,028 (+11.7%) Designations in international applications
39,074 (+5.5%) Designations in international registrations
5,549 (+6.4%) Renewals of international registrations
61,761 (+8.8%) International registrationsin force
27,161 (+6.8%) Designs contained in international applications
25,759 (+2.0%) Designs contained in international registrations
118,667 (+15.1%) Designs contained in designations in international applications
103,882 (+0.7%) Designs contained in designations in international registrations
22,986 (+5.5%) Designs contained in renewals of international registrations
226,164 (+5.2%) Designs contained in international registrations in force
Statistics on Hague international applications
The number of designs contained in applications filed with the Hague System increased by 6.8% in 2024, reaching an all-time high of 27,161
In 2024, the World Intellectual Property Organization (WIPO) received 9,455 international applications for design protection under the Hague System for the International Registration of Industrial Designs, a 10.3% increase over the previous year (see figure 1). Applications contained a record 27,161 designs, representing a 6.8% growth and marking the System’s fourth consecutive year of expansion (see figure 2). The strong 6.8% growth rate in 2024 is largely attributable to China, which accounted for three-fifths of overall growth.


Applicants from at least 68 countries or territories filed one or more Hague application
The accession of Saint Kitts and Nevis in 2024 has increased the number of Hague members to 80. Applicants can now obtain design protection within the territories of 97 countries. Note that there are fewer Hague members than there are countries covered by the System, due to the Hague membership of the African Intellectual Property Organization (OAPI) and the European Union (EU). Applicants can choose to designate these two intergovernmental organizations in an application, each of which affords protection across all their respective member states. In 2024, over 3,600 applicants from at least 68 countries filed international applications.
China has now surpassed Germany to become the top user of the Hague system in 2024
Remarkably, despite only joining the Hague System in 2022, China has now surpassed Germany – the leading filer since 1988 – to become the System’s top user, with 4,870 designs. Following China in the rankings are Germany (4,218), the US (3,031), Italy (2,249) and Switzerland (2,110) (see figure 3).
Five of the top 10 countries experienced double-digit growth in 2024, with China leading the pack at a remarkable 29.6%, followed by Italy (+23.8%), the Kingdom of the Netherlands (+17.4%), the Republic of Korea (+16.8%), and the US (+13.1%). China’s overall growth is largely attributable to a substantial increase in filings by Huawei Technologies. In contrast, four countries experienced a decline, with France (–9.3%) recording the sharpest drop, followed by Germany (–6.7%), Japan (–5%) and Switzerland (–3.9%) (see figure 3).

In 2024, applicants based in Europe accounted for more than half (56%) of all designs filed worldwide (see figure 4). This is largely attributable to the fact that the majority of Hague System members are European countries. However, the proportion of designs originating from Asia has increased significantly over the past 10 years, rising from 5.4% in 2014 to 31.3% in 2024. This growth is primarily due to the accession of China (2022), Japan (2015) and the Republic of Korea (2014) to the Hague System. Similarly, the accession of Canada (2018) and the United States of America (US) (2015) has led to a substantial increase in Northern America’s share, from 5.3% in 2014 to 12% in 2024. In contrast, Africa, Latin America and the Caribbean (LAC), and Oceania collectively had just 0.7% of the total share in 2024. The low share reflects the limited number of Hague Agreement parties within these three regions.

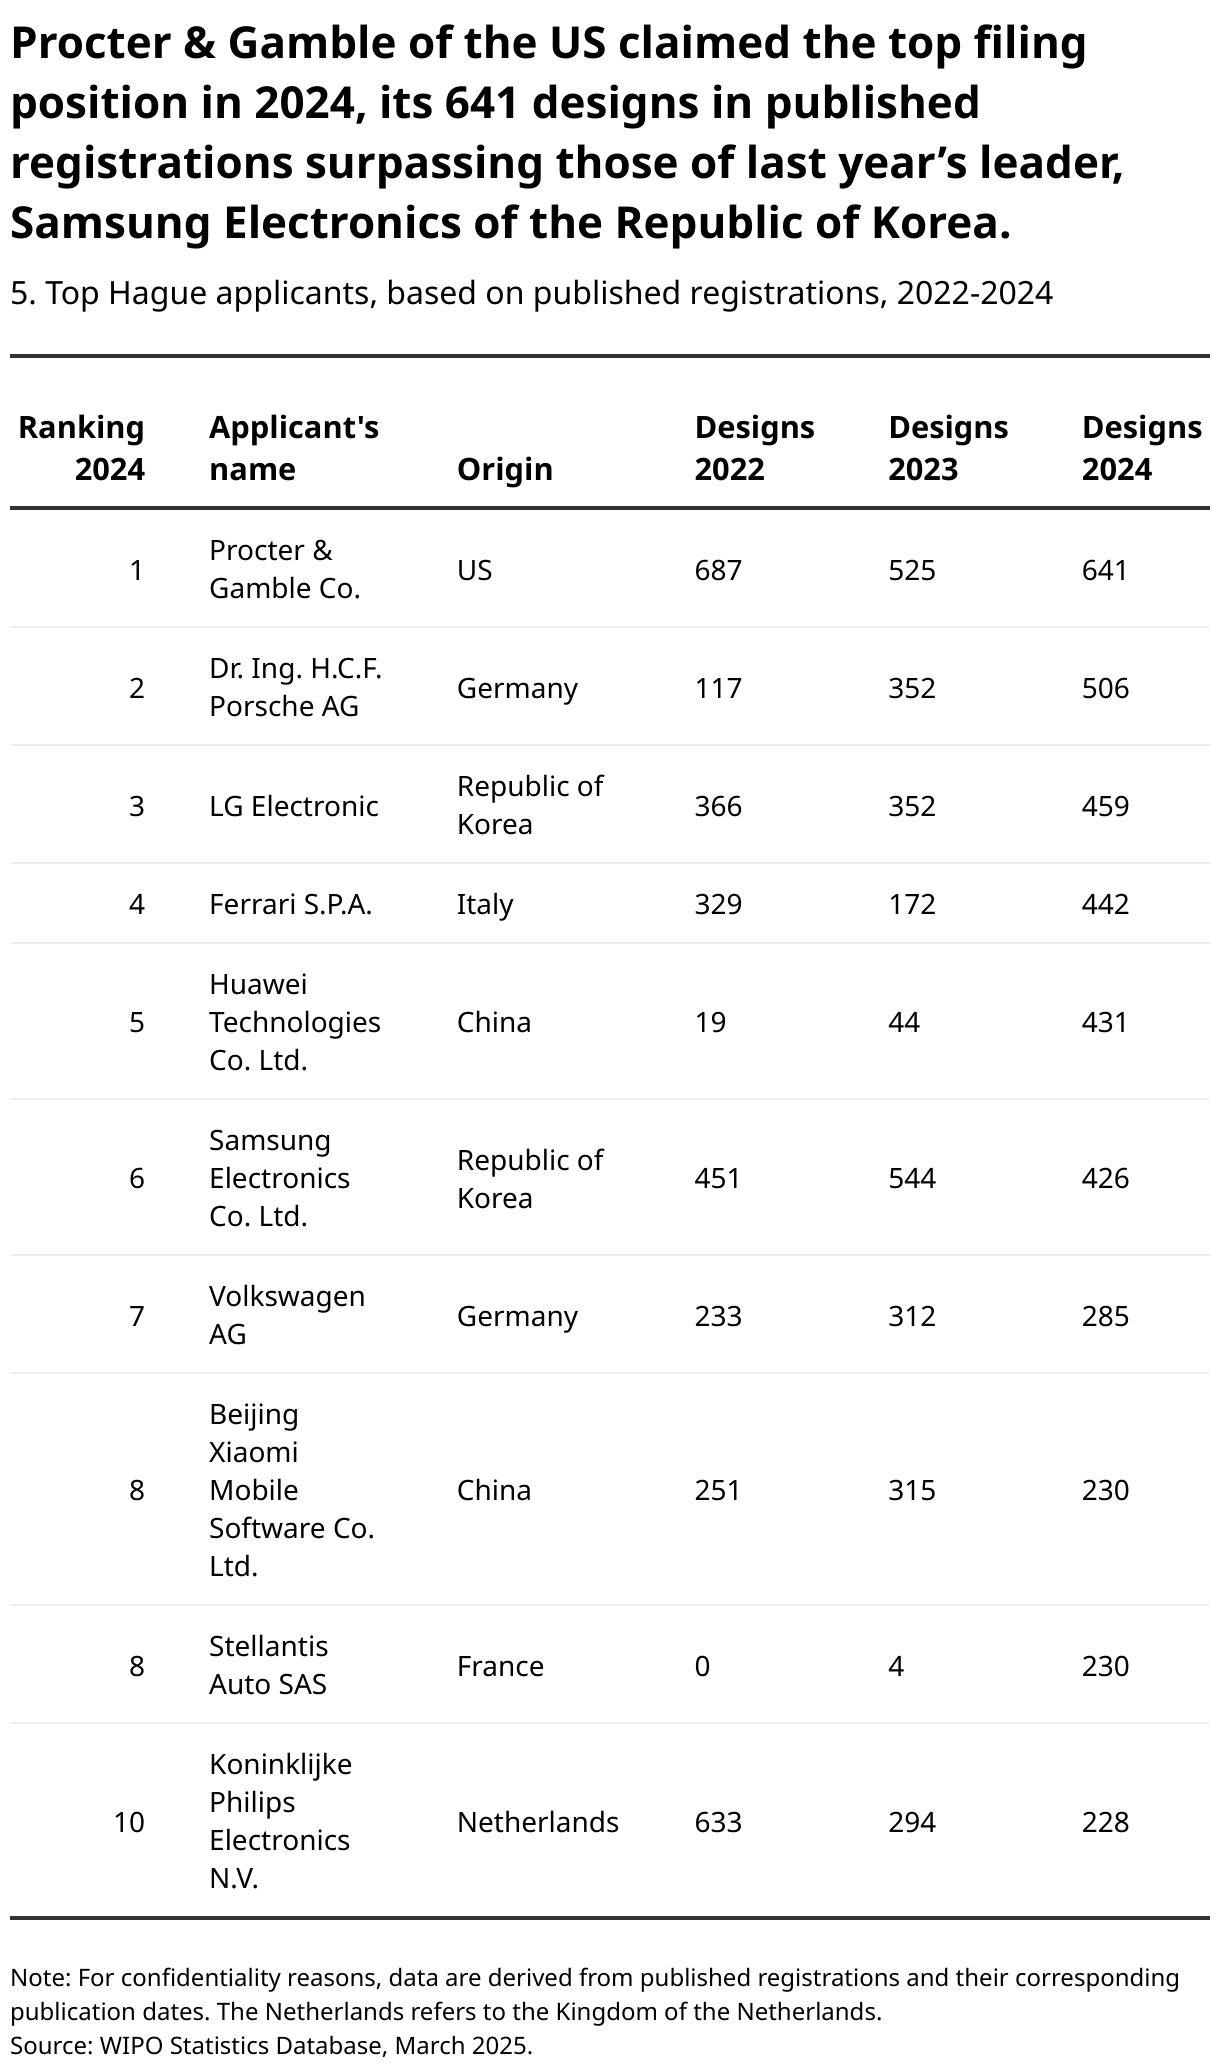
In 2024, the US-based consumer goods firm Procter & Gamble, with 641 designs in published registrations, was the Hague System top user
Procter & Gamble of the US has taken the lead in design filings, with 641 designs in published registrations in 2024 (see table 5). This company displaced Samsung Electronics of the Republic of Korea, last year’s top filer, which dropped to sixth place after having 118 fewer designs in published registrations in 2024, totaling 426. Other top filers were Porsche AG of Germany with 506 designs, LG Electronics of the Republic of Korea with 459, Ferrari SPA of Italy with 442 and Huawei Technologies of China with 431. Four automakers – Ferrari SPA, Porsche AG, Volkswagen AG (Germany) and Stellantis Auto (France) – ranked among the top 10 applicants.
In 2024, six of the top 10 applicants saw substantial increases in designs within published registrations compared to 2023. Huawei Technologies (387 additional designs), Ferrari SPA (270) and Stellantis Auto SAS of France (226) experienced the fastest growth.
The EU received 19,521 design designations in 2024, making it the most designated Hague member in international applications
The Hague System is a mechanism simplifying the process of registering designs in multiple jurisdictions by creating a single international procedure. Applicants can select the Hague members in whose jurisdictions they wish to protect their designs, which are referred to as designated members. In 2024, applicants could seek protection for up to 100 designs in a single international application covering up to 97 countries.
The EU remains the most designated Hague member in international applications, with 6,572designations containing 19,521 designs (see figure 6). The EU has held top position since 2010. Following the EU, the United Kingdom (UK) was the second most designated member, with 15,362 designs, followed by the US (8,945), Switzerland (8,309) and China (6,098). Four of the top 10 most designated members saw a double-digit growth in designs contained in designations, with Canada reporting the fastest increase at 24.8%. Japan (+16.8%), the Republic of Korea (+15.4%) and the US (+10.2%) are the other three countries with double-digit growth.

Designs related to recording and communication equipment accounted for 12.3% of all designs in 2024
In 2024, the largest share of total designs was in recording and communication equipment,accounting for 12.3% of all designs, closely followed by means of transport (Class 12) at 11.1%,packages and containers (Class 9) at 7.9%, furnishings (Class 6) at 7.6% and household goods(Class 7) at 5.1%. The top 10 most specified classes together accounted for 65.7% of all designs in2024, whereas the 10 least specified classes accounted for only 4.2% (see table 7). Among thetop five classes, there was a significant growth in the number of designs relating to recordingand communication equipment (+53.6%) and packages and containers (+22.9%).

Statistics on Hague international registrations
Around 25,800 designs were registered through the Hague System in 2024
The International Bureau (IB) reported 8,847 international registrations in 2024, representing a 5.7% increase over 2023 and marking a third consecutive year of growth. Additionally, the number of designs included in registrations totaled 25,759, a modest 2% increase on the year (see table 8). The long-term trend indicates an upward trajectory, with the number of designs registered via the Hague System having increased 2.5-fold since 2010 – from 10,334 in 2010 to 25,759 in 2024.
China surpassed Germany – which had been the top origin since 2016 – to become the origin with the largest proportion of all design registrations, at 17.4%. China was followed by Germany (15.8%), the US (10.8%), Italy (8%) and Switzerland (7.6%) (see table 8). Among the top five origins, China experienced a 26.9% increase in registered designs in 2024, advancing one position to surpass Germany, which saw an 11.9% decline. In contrast, Switzerland moved down one position to fifth, as the result of a 15.5% decrease in 2024. The US saw a 9.2% increase, whereas France and Italy experienced a modest decline of 2.5% and 0.2%, respectively.

Around 61,800 international registrations, containing around 226,200 designs, were in force in 2024
Active registrations increased by 8.8% to reach 61,761 in 2024. Registrations in force consisted of approximately 226,164 designs. However, the majority of designs and registrations were concentrated in a small number of countries. In 2024, China, France, Germany, Italy, Switzerland and the US collectively held approximately 67.6% of all active designs (see figure 9), slightly below their combined 2019 share of 69.7%.

Statistics on fees
The IB distributed CHF 15.1 million to 78 designated members in 2024
In 2024, designated offices received approximately 15.1 million Swiss francs (CHF) from the International Bureau (IB). The US received the largest share of the total at 23.9%, followed by Japan (19.2%), Canada (12.9%), the EU (10.5%) and China (8.9%) (see table 10). Among the top five recipients, Canada and the US increased their share of the total amount distributed by the IB in 2024 compared to the previous year. Canada’s share rose by four percentage points, while the US saw a 0.8 percentage point increase. In contrast, China (–1 percentage point) the EU (–1.7 percentage points) and Japan (–2 percentage points) saw a decrease over the same period.

Applicants paid an average CHF 2,073 per international registration through the Hague System in 2024
In 2024, the average fee for a Hague international registration was CHF 2,073, which was CHF 15 less than the previous year (see figure 11). Over the past five years, the average registration fee has remained relatively stable, ranging from CHF 2,052 in 2021 to CHF 2,088 in 2023. In 2024, the fee per registration ranged from between CHF 456 for five single-design registrations to CHF 43,949 for a single registration originating from Germany that contained 32 designs and designated 11 Hague members. Around 70% of registrations cost less than the CHF 2,073 average fee, while only 3.4% of registrations cost more than CHF 5,000 per registration.

Statistics on decisions
Decisions conveyed by designated offices to the IB have increased significantly since 2010
Between 2011 and 2023, the number of decisions communicated to the IB by designated offices regarding international registrations far outpaced the number of registrations. In 2011, designated offices communicated 2,529 decisions to the IB, whereas in 2023, they communicated 24,886 decisions. However, the total number of decisions in 2023 was 14% below the peak of 2022, when approximately 28,900 decisions were communicated. Over the same period, the number of registrations increased from 2,302 to 6,015. Consequently, the ratio of decisions per registration increased from 1.1 in 2011 to 4.1 in 2023 (see figure 12). In 2023, the EU communicated the largest share of decisions to the IB, accounting for 31.2% of the total. This was followed by the US (21.9%), Japan (7.7%), the Republic of Korea (7.3%) and Canada (6.5%) (see figure 13). The combined share of these top five offices in 2023 was 74.6%, similar to their combined share in 2022.


In 2023, around 85% of all decisions were transmitted to the IB within 12 months
The proportion of decisions transmitted to the IB exceeding the 12-month timelimit gradually increased from approximately 1.6% in 2011 to approximately 25.9%in 2020. Nonetheless, the proportion has since declined, falling to 14.6% by 2023. In2023, around 85% of all decisions were transmitted to the IB within 12 months, andanother 12.6% within 18 months (see figure 14). Roughly, 2% of all decisions tookmore than 18 months from the publication date to be conveyed to the IB. Timelinesfor decisions vary significantly across designated offices, depending on the type of decision.
