
This chapter presents the main findings from the Global Innovation Index (GII) 2026, highlighting top-performing economies across different income groups and world regions. It identifies innovation leaders and innovation overperformers achieving results beyond expectations for their development level.
The GII 2026 rankings primarily reflect data from 2024 to 2026 (representing over 80 percent of all data points). Appendix I provides comprehensive guidance on how to interpret the results properly, explaining the methodological considerations that affect direct comparisons being made between annual rankings.
Who leads global innovation in 2026?
Switzerland, Sweden and the United States remain the world’s top three innovation economies. Despite global economic and geopolitical turbulence, the top 25 at the innovation frontier remains persistent, but not frozen
Switzerland – ranked 1st for a 16th consecutive year – Sweden and the United States remain the world’s top three innovation economies. In a period of major geopolitical and economic turbulence, the most striking feature about the top of the ranking is its stability. The leading economies are broadly those of 2025. No new economy enters the top 15, and Europe again accounts for the largest share of the leading group – with 14 economies out of 25 innovation leaders, and the Kingdom of the Netherlands moving up to 7th and Austria to 18th. The main signal at the innovation frontier this year is continuity, rather than the emergence of any single new entrant.
Asia is also firmly embedded among the top ranks, with five economies in the top 25. The Republic of Korea and Singapore consolidate 4th and 5th place respectively, China remains 10th – as the only middle-income economy among the innovation leaders, Japan holds 12th and Hong Kong, China climbs to 14th (Figure 1). This Asian presence is now an established feature of the top ranks, rather than a development unique to this year.
The Republic of Korea model is built around exceptional corporate research and technological development: it ranks 1st in business-performed R&D, researchers employed by business and PCT patents by inventor origin, and 2nd in overall R&D expenditure. Seoul’s rise to 4th among the world's top innovation clusters reinforces this picture. Singapore continues to provide the strongest overall environment for innovation inputs (1st). China’s sustained position within the top 10 remains the clearest long-term structural shift.
Japan’s continued presence at 12th reflects the strength of its industrial and corporate innovation, which is among the strongest in the world. Japan ranks 1st in production and export complexity, 3rd in patent families and 3rd in business-performed R&D. Tokyo–Yokohama remains the world’s second-ranked top innovation cluster, reflecting the global weight of Japan’s patenting, research and venture capital activity.
Estonia (17th) remains one of the most consistent long-term upward performers in the Index. Its model continues to rest on digital adoption and scalable intangible activity: Estonia ranks 2nd in ICT use, 3rd in ICT services imports, 6th in ICT services exports and 1st in unicorn valuation.
Beneath the continuity, there is still movement: Australia, Canada and New Zealand regain ground
Beneath the continuity at the top of the GII, Canada (16th), Australia (20th) and New Zealand (24th) move back up the ranking, returning closer to their pre-pandemic positions. Their respective recoveries follow a similar pattern: each is a mature innovation system regaining ground through strengthening its academic system, improving the links between universities and firms, and rebuilding research investment. In Canada, the rebound is supported by R&D expenditure equaling around 1.8 percent of GDP in 2025, and growing corporate R&D spending (18th).

Australia returns to the top 20, with innovation inputs rising to 13th and outputs to 24th. Progress is supported by world class universities (4th), a stronger university–industry R&D collaboration (6th) and a big improvement in cluster development (5th), alongside further integration into international knowledge flows through corporate R&D investors (15th), and intellectual property payments (12th) and receipts (16th). Production and export complexity has also improved (72nd) – even if at a lower level.
New Zealand’s rise to 24th is driven by a broad strengthening of innovation inputs (17th), with Institutions reaching 3rd and government effectiveness 5th. Gains in tertiary education (21st), science and engineering graduates (51st), ecological sustainability (30th) and global corporate R&D investors (30th) serve to reinforce this improvement.
Over time, the GII has grown from a benchmarking exercise into a working tool for innovation policy. In WIPO’s 2025–2026 survey, 78 percent of responding member states (93 of 120) reported using the GII, most often to improve innovation ecosystems and policy (63 percent), strengthen innovation data (53 percent) or as a reference when formulating economic plans and policies (41 percent).
Uptake is broad among WIPO member states. Reported use is highest among member states in Asia and the Pacific (85 percent), followed by transition and developed countries (80 percent), Latin America and the Caribbean and Africa (both 74 percent) and the Arab countries (69 percent). By income level, reported use is highest among lower middle-income economies (89 percent).
To support this engagement, the WIPO GII team organizes up to 80 national and regional events every year and helps governments to set up interministerial task forces.
The GII encourages evidence-based policymaking through a two-step approach:
Assessment: bring together policymakers, statisticians and innovation actors to analyze national innovation performance.
Response: identify strengths and weaknesses, then designs policy measures coordinated with public and private actors.
Key implementation practices
There are four key practices essential to innovation policy implementation:
Policy integration: embed innovation and intellectual property (IP) in national economic development strategy frameworks and set up interministerial task forces that adopt a whole-of-government approach and report to senior leadership.
Stakeholder engagement: consult widely with startups, universities, large companies, IP stakeholders and innovation clusters, and align national IP policy with the broader innovation strategy.
Measurable outcomes: set clear, quantifiable targets so that progress can be tracked and policies adjusted.
Realistic targets: aim for steady improvement in the system rather than quick movements in the ranking and allow time for policy effects to show.
The GII Innovation Ecosystems & Data Explorer 2026 allows users to generate economy briefs and profiles and make country comparisons; follow the time series behind each indicator; and explore micro-data on intangible assets, top universities and leading brands. Recent editions have added cluster and regional briefs, such as for the Association of Southeast Asian Nations (ASEAN), or least developed countries (LDCs); and the underlying datasets, including Innovation Tracker data, are available to download.
WIPO also works with those economies interested in joining the GII. On request, the GII team produces a monitoring dashboard that shows a prospective member where its data is either missing or outdated and how many indicators, and which ones, it would need to supply in order to qualify. After a careful prioritization of such gaps, WIPO connects the country in question with the relevant data providers. This approach works best when the country in question stays actively engaged throughout the process. Bhutan joins the GII in 2026, having followed a dedicated process of this kind.
Expanding use at the sub-national level
The GII also supports better innovation measurement and policy at the sub-national level, whether it be regional, provincial or city. The GII innovation cluster ranking serves to identify those geographical areas worldwide that have the highest density of inventors, scientific authors and venture capital deals. The WIPO Toolkit Enabling Innovation Measurement at the Sub-National Level helps those member states that want to build their own sub-national metrics or indices. It sets out what GII indicators work at the sub-national level, reviews existing indices in Brazil, China, Colombia, the European Union, India and Viet Nam, and points to new sources of big data suited to measuring innovation locally.
Innovating innovation metrics
To advance the measurement of innovation, WIPO runs the GII iLens Innovation Data Lab, launched in 2024. Its 2025 and 2026 workshops examined venture capital and private equity metrics, startups and high-growth firms, deep science such as genome sequencing, the limits of AI-related data, and the measurement of industrialization and investment. Drawing on new data sources and methods, including web scraping and geospatial analysis, the Lab’s findings feed into future GII editions and widen the set of tools available for innovation measurement.
Several economies reach new ranking milestones in 2026
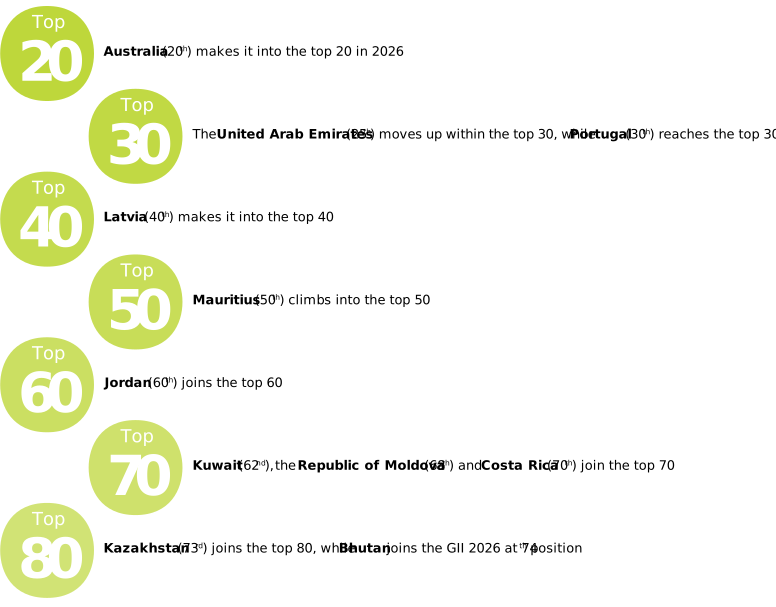
Several economies cross important ranking thresholds in 2026 (Figure 2). At the upper end, Portugal (30th) reaches the top 30, thanks to an ecosystem that combines domestic industry diversification (1st), scientific production – with scientific and technical articles ranked 11th, researchers (12th), business-financed R&D (16th) and finance for startups and scaleups (19th). Two Baltic economies have moved up. Lithuania moves further up within the top 40, to 32nd, while Latvia enters the top 40 at 40th place.
 Note: Year-on-year comparisons of GII rankings must take into account the changes to the GII model that have occurred overtime, as well as data availability.
Further down the ranking, Kuwait advances into the top 70 at 62nd. Its progress builds on its enabling conditions, particularly ICT access (4th) and ICT use (3rd), alongside strengthening financing and investment indicators. The Republic of Moldova rises to 68th, combining more limited innovation inputs (94th) with comparatively strong, digitally enabled outputs (51st).
Costa Rica (70th) also enters the top 70. Its position reflects an internationalized, service-oriented ecosystem, supported by green-field R&D and high-tech FDI (1st) – showing its attractiveness as a location for innovation-intensive investment, ICT services exports (14th) and its productivity growth (17th).
Within the top 80, Kazakhstan rises to 73rd, the biggest advance in Central and Southern Asia. Close behind, Bhutan enters the GII for the first time at 74th place.
Switzerland, China, India and Rwanda are income group leaders; Thailand ramps up among upper middle-income economies; while Kazakhstan, Bhutan and Saudi Arabia reach the top of their regions
Beyond charting movement among the innovation leaders, the GII 2026 records notable shifts across income groups and world regions. Switzerland, China, India and Rwanda are leaders of their respective income groups (Table 1).
China remains the highest-ranked middle-income economy at 10th and the only such economy in the top 30. Malaysia (34th) and India (38th) remain in the top 40, while Viet Nam (43rd), Thailand (44th), Türkiye (45th), the Philippines (52nd), Morocco (54th) and Indonesia (55th) reinforce the growing presence of middle-income economies in the upper half of the rankings.

Among low-income economies, Rwanda records the strongest advance, rising to 96th, followed by Madagascar, which moves up to 113th place.
Northern Africa and Western Asia also sees important upward movement, with Saudi Arabia (42nd) reaching fourth place in the region. Among others, Tunisia moves up to 71st, Egypt to 83rd, Azerbaijan rises to 85th, Lebanon to 86th and Algeria to 111th. In South East Asia, East Asia and Oceania, Viet Nam rises to 43rd, Thailand to 44th, Mongolia moves up to 72nd and Cambodia to 93rd. Central and Southern Asia strengthens its position through gains across several economies. India remains the regional leader at 38th, Kazakhstan (73rd) moves up to take 2nd position, followed by Bhutan (74th). Kyrgyzstan and Pakistan each gain four places, moving up to 92nd and 95th respectively. Nepal climbs to 104th place and Bangladesh to 105th.
Latin America and the Caribbean is led by Chile (51st), Brazil (53rd), Mexico (65th), Uruguay (66th) and Costa Rica (70th). Ecuador (106th) and Trinidad and Tobago (107th) each advance seven places, while Honduras (116th), Guatemala (120th), Nicaragua (124th) and the Bolivarian Republic of Venezuela (127th) also rise. Sub-Saharan Africa records some of the largest individual advances. Mauritius leads the region at 50th, followed by South Africa (63rd), Botswana (82nd) and Senegal (90th). Kenya rises five places to 97th place.
Who is gaining momentum? And who are the innovation climbers in 2026?
A group of middle-income economies has climbed the upper half of the GII as far as the top 40, but the road ahead gets steeper
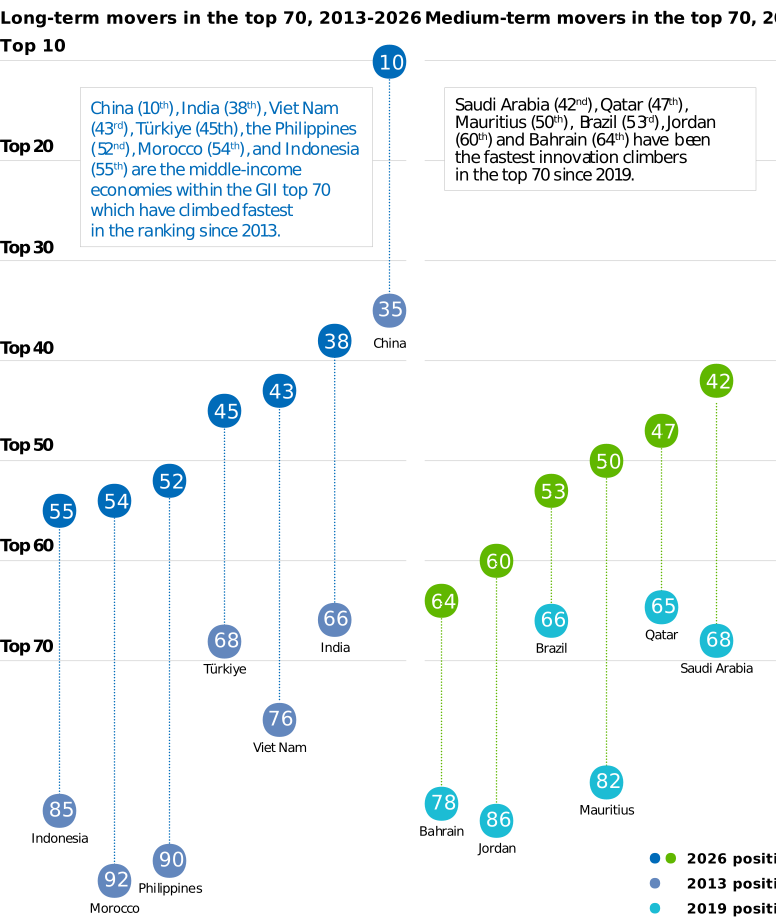
China (10th), India (38th), Viet Nam (43rd), Türkiye (45th), the Philippines (52nd), Morocco (54th) and Indonesia (55th) are those middle-income economies within the GII top 70 that have made the strongest long-term advances since 2013 (Figure 3). Their progress has followed different routes, but they share one feature: they have built firms, sectors and production networks able to turn selected strengths into innovation results. In several cases, innovation outputs now exceed the level suggested by innovation inputs. China ranks 5th in outputs compared with 22nd in inputs, India 25th and 49th, Viet Nam 35th and 54th, the Philippines 49th and 69th and Morocco 46th and 76th. Their rise has therefore depended not only on an expansion of innovation resources, but also on connecting domestic capabilities to markets – through global value chains, high-tech trade, digital services, design, branding, intellectual property and startup activity. But while this helps explain their progress, it also points toward the next barrier: climbing beyond the top 40 or top 50 requires a broader research capacity, stronger business R&D, deeper science–industry linkages and more domestic knowledge creation.
A benchmarking exercise against high- and middle-income medians shows where the catch-up is strongest (Box 2). The seven middle-income climbers have moved closest to high-income economies in those indicators related to production and exports, and to a lesser extent to those related to startup support and access to finance. Convergence is weaker in the slower-building parts of the innovation system: R&D, the research and academic infrastructure, scientific production and impact and its connectivity with the private sector. This is the effective ceiling for most middle-income climbers. China is the exception. It reaches high-income levels across most areas, including R&D expenditure levels, business R&D, high-tech manufacturing and intellectual property use, which helps explain why it alone has entered the top 10.
 Note: Changes in methodology and variations in data availability may affect year-to-year comparisons of GII rankings. The GII model undergoes periodic refinements, which should be considered when interpreting longitudinal performance trends.
For most other middle-income climbers, moving beyond the top 40 or top 50 requires more than strong performance in global production networks, exports and intellectual property use. Morocco and Viet Nam remain among the more dynamic recent stories, with Viet Nam bouncing back to pre-pandemic levels and Morocco climbing to its best rank ever at 54th. India and the Philippines have made important jumps and are now hovering at around the top 40 or top 50. Indonesia has stabilized at around 55th in the last three years, whereas Türkiye has declined in the past two years. What still holds most of these economies back is the depth and breadth of the innovation system: research capacity, university quality, scientific production, business R&D, patenting and science–industry linkages are not yet strong enough across the board.
The seven long-term middle-income innovation climbers identified in Figure 3 – China (10th), India (38th), Viet Nam (43rd), Türkiye (45th), the Philippines (52nd), Morocco (54th) and Indonesia (55th) – have moved closer to high-income innovation performance, but have done so unevenly.
To examine where convergence is taking place, this box compares their performance across 25 indicators grouped into five areas: knowledge base, R&D, startup and finance ecosystem, production and exports, and intellectual property. Each indicator is classified as Higher, Medium or Lower, depending on whether the economy reaches the high-income median, lies between the middle- and high-income medians, or falls below the middle-income median (Box Table 2.1).

The comparison points to selective rather than uniform convergence. Except for China, the long-term climbers have not yet reached high-income performance across the entire innovation system. Instead, each has developed a distinct combination of capabilities that has supported its rise in the ranking. The next stage of catch-up will depend on whether these strengths can be complemented by deeper research systems, broader knowledge creation and stronger connections across the innovation ecosystem.
Three points stand out. First, convergence has been easiest in respect to startup finance, production and exports, and intellectual property, and hardest in the knowledge base and R&D, where deep research capacity builds slowly and where most climbers remain within the medium range. This is the effective ceiling for middle-income catch-up. Second, China is the exception that defines the rule. It has broken through by building that research base, reaching high-income levels in 21 of 25 indicators, while the others have not. Third, the position of the remaining climbers is not uniform. India holds the second-broadest profile, but remains thin in respect to researchers and scientific articles; Viet Nam and the Philippines lead in production and trade, yet trail in domestic invention; and several have advanced faster on production and exports and IP measures than on the research foundations needed to sustain that progress. Whether these economies keep rising or plateau will depend on whether they can complement their market strengths with the slower-building research systems that China has built to reach the top of the rankings.
Unlike China, which is discussed at length in Box 2, India’s pathway is more strongly shaped by digital services, venture capital and entrepreneurship. It has one of the broadest profiles among the seven middle-income climbers (Box 2). It leads globally in ICT services exports (1st), ranks 4th in late-stage venture capital deals and performs strongly in intangible asset intensity (13th). These capabilities have helped India reach 15th in Knowledge and technology outputs, although further progress will depend on spreading research, technology adoption and firm-level innovation beyond its leading digital and startup sectors.
Viet Nam and the Philippines have advanced through integration into international manufacturing and service networks. Both reach high-income levels in high-tech manufacturing and high-tech exports, as well as in indicators linked to unicorn valuation and global brands. Viet Nam leads in both high-tech exports and creative goods exports and ranks 3rd in high-tech imports, while the Philippines ranks 4th in high-tech exports, 6th in high-tech imports and 23rd in high-tech manufacturing. Their next step is to move into higher-value functions within those networks by expanding domestic research, patenting and knowledge creation. Both remain below the middle-income median in terms of scientific articles and PCT patenting, suggesting that their international production strengths still exceed their domestic knowledge-generation and invention capabilities.
Türkiye follows a more industrial and intangible asset-intensive route. Türkiye is particularly strong in R&D and intellectual property. Domestic industry diversification (5th), industrial designs (6th), trademarks (7th) and Creative outputs (28th) indicate strong capabilities in manufacturing, design and branding. Research talent (8th) and tertiary enrolment (9th) provide an additional foundation for moving toward more technology-intensive production and productivity growth. But its strengths may benefit from sustained improvements across the wider enabling environment, including education (77th), tertiary education (58th), the regulatory environment (102nd) and the business environment (103rd).
Indonesia has advanced through its large domestic market (7th), expanding digital economy and increasingly active startup-finance environment – with finance for startups and scaleups ranked 12th and late-stage venture capital at 26th – both comparable to high-income economy levels. However, its R&D base remains comparatively thin. Indonesia’s R&D expenditures as a percentage of GDP were equal to only 0.3 percent of GDP in 2020 – the latest available data point; R&D performed by business was only 0.02 percent of GDP; and researchers working in the private sector, only represented 4.4 percent of all researchers. The next phase of its development will depend on strengthening research capacity and the connections between universities, startups and established firms.
Since 2019, and beyond the longer-term innovation climbers, a newer group has gained momentum, often through investment, digital transformation and services
Since 2019, Saudi Arabia (42nd), Qatar (47th), Mauritius (50th), Brazil (53rd), Jordan (60th) and Bahrain (64th) have recorded some of the strongest sustained advances among economies now ranked within the GII top 70.
Much of the momentum in Western Asia Gulf economies has been innovation input-led. Saudi Arabia’s rise is supported by rapid digital adoption, reflected in its global leadership in ICT use (1st), and its government online services (4th). Its innovation geography is also becoming more visible: Riyadh enters the world’s top 100 innovation clusters at 92nd place in 2026, showing a growing concentration of science, technology and venture capital activity. Qatar’s strength is more based on its talent and robust Infrastructure (16th), leading in tertiary inbound mobility (1st). Jordan reaches the top 60 through a more knowledge-intensive route, excelling in scientific production – ranking 1st in scientific and technical articles, and showing exceptional performance relative to the overall scale of its system. Bahrain’s progress similarly reflects an enabling environment built around digital connectivity – ranking 1st in ICT access, 10th in ICT use, and with additional strengths in government online service (23rd) and computer software spending (23rd). In addition, its general infrastructure (2nd), and its business environment (6th) are among the world’s best.
Beyond Western Asia Gulf economies, Mauritius’s rise to 50th place reflects the relative success of a small economy that has used services, digital connectivity and investment to diversify its innovation paths. Mauritius has built a competitive services platform around ICTs, financial and professional services, creative exports and digitally enabled business activity. This helps explain why Mauritius performs strongly in cultural and creative services exports (6th), ICT use (25th), venture capital investors (6th), market capitalization (25th) and green-field R&D and high-tech FDI (23rd). The next step is to move further up the value chain, from outsourced and back-office services toward higher-value digital products, data services, fintech, software, and creative industries for African and global markets.
Brazil holds up this year thanks to a combination of having a large domestic market (8th), as well as strengths in science, entrepreneurship and intangible assets ahead of other Latin American economies. Its strong trademark activity (8th), intellectual property payments (13th), late-stage venture capital (16th), corporate R&D investors (23rd) and utility models (24th) support an ecosystem that has strengths in science and business activity. São Paulo’s continuing presence among the leading global innovation clusters – ranked 49th – in 2026, reinforces Brazil’s role as Latin America’s main research, technology and startup hub. Brazil’s challenge continues to be to turn these strengths into broader productivity gains (labor productivity growth remains low – at rank 94th), strengthen R&D performed by the private sector (36th) and improve its business environment (129th) and the availability of human capital in support of innovation (e.g., graduates in science and engineering, ranked 101st) – particularly beyond São Paulo and other major hubs.
Which economies do more with less?
India and Viet Nam are the longest-standing overperformers. Mozambique, Pakistan and the Republic of Moldova return to the group in 2026, and Bhutan is an overperformer in its first year
Innovation overperformance shows that innovation does not follow a straight line from income to results. The GII 2026 identifies 21 economies that perform above expectations for their level of economic development, four more than in 2025 (Figure 4). India and Viet Nam remain the longest-standing innovation overperformers, having sustained this status for 16 consecutive years. The Republic of Moldova follows with 15 appearances, returning to the group in 2026, while Rwanda and Ukraine have each overperformed in 14 editions. Thailand has done so 12 times, followed by Malawi at 11 times and Jordan, Madagascar and Mozambique at 10 each. Mozambique and Pakistan also return to the group this year, while Bhutan joins for the first time. This year, 10 of the 21 overperformers ramp up their rankings – namely, Jordan, Madagascar, Morocco, Pakistan, the Republic of Moldova, Rwanda, Thailand, Tunisia, Uzbekistan and Viet Nam.
Overperformance is concentrated among middle-income economies: 10 of the 21 are lower middle-income economies, six are upper middle-income and five are low-income. Sub-Saharan Africa accounts for the largest number, with seven economies, followed by Central and Southern Asia and South East Asia, East Asia and Oceania, with four each. Northern Africa and Western Asia contributes three, Europe two, and Brazil remains the only overperformer in Latin America and the Caribbean (Table 2).
Several economies have overperformed for an extended periods. South Africa (63rd) records its ninth consecutive year as an overperformer, while Senegal (90th) does so for the ninth time overall. The Philippines (52nd) and Morocco (54th) have each reached eight appearances, and Brazil (53rd) extends its uninterrupted period of overperformance to six years. Indonesia (55th) and Uzbekistan (77th) have now performed above expectations for five consecutive years.

Bhutan enters the GII with an innovation profile that combines a relatively strong institutional (36th) and regulatory environment (52nd) with digital upgrading and ecological sustainability (3rd). Gross capital formation (1st), and low-carbon energy use (2nd) are high, and it has a relatively strong performance in software spending (21st) and high-tech imports (23rd). Digital transformation and economic diversification are a policy priority, although ICT use (92nd) remains a challenge. Bhutan’s innovation challenge is therefore to use its strong institutions, clean-energy base and digital ambitions to build a small but differentiated ecosystem around sustainable investment, creative industries and digital services.

Uzbekistan rises two places and maintains its overperformer status for a fifth consecutive year. Its ecosystem combines a supportive business environment (8th) with growing human capital and intellectual property strengths (e.g., utility models are ranked 14th). Uzbekistan ranks 3rd in entrepreneurship policies and culture, 4th in finance for startups and scaleups, 7th in labor productivity growth and 12th in gross capital formation.
Pakistan advances to 95th place and retakes its overperformer status for the fourth time. Its strengths are concentrated in the digital economy: mobile app creation (10th), ICT services exports (15th), high-tech imports (19th), and software spending (33rd). Its relatively strong scientific production (49th) and university quality (47th) support a developing digital economy.
Mozambique (129th) returns to the group of overperformers for a tenth time. Its profile combines strengths in investment, demographics, education and creative activity. It ranks 4th in FDI net inflows, 6th in its youth demographic profile, 19th in both education expenditure and low-carbon energy use, and 27th in microfinance. Its innovation outputs have also broadened in 2026, with industrial designs rising (42nd), together with creative goods exports (69th).
At the other end of the spectrum, 39 economies perform below expectations for their level of economic development in 2026, one more than in 2025.
Latin America and the Caribbean account for the largest share, with 14 economies, followed by Sub-Saharan Africa with nine, and Northern Africa and Western Asia with seven. This group also includes six European economies, two from South East Asia, East Asia and Oceania, and one from Central and Southern Asia. Several high-income economies in Northern Africa and Western Asia remain in this category, including Saudi Arabia (42nd), Qatar (47th), Kuwait (62nd), Bahrain (64th) and Oman (69th), reflecting a gap between strong enabling conditions and the innovation outputs currently generated. In other economies, performance below expectations often reflects an uneven development across the different pillars of the innovation system. It is important to note that as this classification is relative to income level, it should not be interpreted as indicating an absence of significant innovation strengths.
China generates innovation outputs comparable to high-income economies, while others like Morocco, Pakistan, Madagascar and Zimbabwe generate higher-than-expected outputs from more limited innovation inputs
Overperformance compares innovation performance with income level. This section asks a different question – how effectively are innovation inputs converted into outputs?
Figure 5 locates economies in four quadrants according to whether their input and output scores are above or below the global median, thereby showing their absolute position within the innovation landscape. A line then estimates the output level normally associated with a given input score. Economies above the line generate more outputs than expected from their inputs, while those below it have scope to convert enabling conditions more fully into innovation results.
Switzerland (1st) combines both dimensions of performance: it ranks 2nd in innovation inputs and 1st in innovation outputs, generating an output score around 11 points above the level predicted by its level of innovation inputs. Sweden (2nd), the United States (3rd), the Republic of Korea (4th) and the United Kingdom (6th) also occupy the high-input/high-output quadrant. The United Kingdom is especially efficient, ranking 10th in inputs but 4th in outputs. Germany (11th) and Italy (27th) likewise generate relatively strong outputs, ranking 8th and 16th respectively, despite ranking lower in inputs at 14th and 36th.
China is the most prominent outlier, recording the farthest positive distance from the line. Its output score exceeds that of several economies with higher input levels, including Singapore (5th), Germany (11th) and Australia (20th). Singapore (5th) remains an innovation leader, ranking 1st in inputs and 9th in outputs, showing that abundant inputs do not automatically produce proportionately higher output scores across every dimension.
Several middle-income economies combine below-median or moderate inputs with outputs substantially above expectations. India (38th) ranks 49th in inputs but 25th in outputs; Morocco (54th) ranks 76th and 46th respectively; and the Islamic Republic of Iran (81st) ranks 104th in inputs but 58th in outputs. Viet Nam (43rd), Türkiye (45th), Tunisia (71st) and Mexico (65th) display a similar pattern. Among economies with more constrained input bases, Pakistan (95th), Madagascar (113th), Nigeria (118th) and Zimbabwe (132nd) also lie above the regression line, indicating an output performance that is comparatively strong relative to available inputs.

The high-input/low-output quadrant provides a different policy signal. The United Arab Emirates (25th) ranks 12th in inputs but 42nd in outputs, while Saudi Arabia (42nd) ranks 30th and 62nd, and Qatar (47th) ranks 33rd and 67th. These economies have built substantial institutional, infrastructure and investment foundations; the next stage is to convert these assets into scalable results.
Where are innovation systems unbalanced?
Innovation leaders have balanced innovation ecosystems, while emerging economies such as Rwanda, Algeria, Cambodia and Pakistan can build on standout strengths to improve their overall innovation performance
Most economies in the GII top 25 display a relatively balanced innovation ecosystem, with strong rankings across several input and output pillars. Switzerland, Sweden, the United States, the Republic of Korea and Singapore are examples of such a balanced ecosystem. China (10th) stands apart among the leaders in having a comparatively lower Institutions ranking (48th).
Further down the GII ranking, larger gaps between pillars reveal how innovation systems evolve. Rwanda (96th) ranks 26th in Institutions, Azerbaijan (85th) 36th and Botswana (82nd) 41st. Similarly, Human capital and research is a relative strength in Algeria (39th versus 111th overall), Tunisia (45th versus 71st), Peru (53rd versus 80th), the Islamic Republic of Iran (56th versus 81st) and Kyrgyzstan (64th versus 92nd) (Table 3).

A higher Market sophistication ranking points to favorable conditions for finance, investment or trade. Bosnia and Herzegovina ranks 23rd in this pillar despite placing 84th overall, Cambodia 31st versus 93rd, and Nicaragua 36th versus 124th. Business sophistication identifies firm capabilities that are comparatively well developed, the availability of knowledge workers and innovation linkages. In this pillar, Cameroon ranks 39th versus 121st overall, Malawi 50th versus 126th, Costa Rica 40th versus 70th, and Botswana 59th versus 82nd.
Conversely, the Islamic Republic of Iran (81st) reaches 54th in Knowledge and technology outputs and 64th in Creative outputs, relative to considerably lower Infrastructure (91st) and Institutions (136th) rankings.
Such imbalances are not necessarily weaknesses. Rather, they identify assets that economies can build upon: input-led systems need stronger channels from institutions and investment to commercialization, while output-led systems can develop further through reinforcing infrastructure, research and financing foundations to sustain existing strengths.
Traditional measures of foreign direct investment (FDI) – stocks and flows – record how much capital has been deployed. The GII has long tracked them through its FDI net inflows indicator (5.3.4), based on International Monetary Fund (IMF) balance-of-payments data. This data is indispensable, but it is more of a retrospective – typically published after a lag of a year or more, highly aggregated, and blind to the innovation-intensity and general nature of the investment: the purchase of an existing manufacturing plant or the stake in registers in the same way as does the purchase of a new AI data center.
To complement this data with a more forward-looking and innovation-specific metric, in partnership with FT Locations the GII 2026 introduces a new indicator, Green-field R&D & high-tech FDI (5.3.5), based on announced green-field investment projects as per the FT Locations fDi Markets database. Green-field FDI is defined as a cross-border investment in a new physical project, or the expansion of an existing one, that creates new jobs and capital investment. By our “R&D and high-tech” definition, announcements enter the indicator when fDi Markets classifies their business activity as R&D or as design, development and testing, or when they fall within high-tech sectors such as semiconductors, biotechnology, and pharmaceuticals, and software and information technology (IT) services.
In 2025, firms announced close to 6,000 R&D and high-tech projects worldwide – 1,201 R&D projects and 4,769 high-tech ones. That is roughly one in three of the broadly 16,500 green-field projects of all kinds recorded globally in 2025.
Corporate decisions on where to locate R&D and high-tech investments focus on a narrow number of economies. The top 10 destination economies attracted 58 percent of such projects, with the United States, India and the United Arab Emirates in the lead. Concentration is even stronger on the outward side: the top 10 source economies generated 70 percent of all announcements, led by the United States – the origin of one in four projects worldwide – followed by Germany and the United Kingdom.
Box Figure 3.1 maps this two-way geography, plotting each economy’s inbound project announcements in 2025 against its outbound ones, with bubble size reflecting the total announced capital investment. Sixteen economies lie above the world average on both axes, the global investment hubs of the top-right quadrant. Fourteen of these are high-income economies. China and India are the only exceptions. Seven hubs are European, five are in East and South East Asia and Oceania (Australia, China, Japan, the Republic of Korea and Singapore), the United States and Canada represent Northern America, and the United Arab Emirates completes the group.

The bottom-right quadrant hosts the 14 investment magnets, which are those economies above the world average on inflows, but not on outflows. Ten of these are middle-income economies, and this group is the most geographically dispersed: five economies in South East Asia (Indonesia, Malaysia, the Philippines, Thailand and Viet Nam), three in Latin America (Brazil, Colombia and Mexico), three in Northern Africa and Western Asia (Qatar, Saudi Arabia and Türkiye), Poland and Portugal in Europe, and South Africa, the only Sub-Saharan African economy above the world average on either axis. For these magnets, investment is essentially a one-way flow: Indonesia received 59 projects in 2025 against a single outbound announcement, and the Philippines 43 against three. Mexico is the strongest magnet, attracting 188 projects in 2025 against only six outbound announcements. Saudi Arabia (149 against 19) and Poland (119 against 19) follow as the quadrant’s next largest recipients. Brazil (111 against 36) and Türkiye (88 against 32) announce roughly one project abroad for every three they receive, leaving them closest of the magnets to achieving hub status.
The remaining quadrants complete the picture: eight economies are outward investment leaders, investing abroad far more than they receive – all are high-income, among them Switzerland, Sweden, Denmark, Israel and Hong Kong, China. All other economies – nascent investors – are not yet at the world average on both axes.
What do regional patterns tell us about the geography of innovation?
Central and Southern Asia consolidates its lead over Latin America and the Caribbean through having stronger innovation outputs, while regional gaps increasingly reflect how effectively innovation inputs are being converted into results
Northern America remains the world’s leading innovation region in 2026, with the highest average GII score and a clear lead in both innovation inputs and outputs (Figure 6). Europe follows, thanks to having broad strengths across Institutions, Human capital and research, Infrastructure, and Creative outputs, while South East Asia, East Asia and Oceania is in 3rd place. The latter continues to stand out for its Institutions, Infrastructure, and Market sophistication.
Northern Africa and Western Asia occupies 4th position. Its performance is comparatively strong in Institutions and Infrastructure, although the gap between inputs and outputs remains wide.

Central and Southern Asia strengthens its position ahead of Latin America and the Caribbean. The average input scores for both regions are now almost identical – with the former being slightly ahead, but Central and Southern Asia has a clearer advantage in outputs. Latin America and the Caribbean has a relative advantage in Business sophistication, suggesting that its central challenge is not the absence of private sector capabilities, but connecting them more effectively to research, commercialization and technology production.
Sub-Saharan Africa scores less well than other regions, but its innovation profile is more varied than the headline average suggests. The region performs relatively better on Institutions, with an average score close to those of Central and Southern Asia and Latin America and the Caribbean, and its Business sophistication exceeds that of Central and Southern Asia. The region’s largest gaps remain in Human capital and research, Infrastructure, and both output pillars.
The sections that follow show the most significant developments happening across the seven world regions.
Northern America
Northern America remains the world’s strongest innovation region, led by the United States, which retains 3rd place globally, while Canada rises one position to 16th.
The United States leads in Market sophistication (1st) and ranks 2nd in Business sophistication, underpinned by having the world’s largest corporate R&D investors (1st), strong business-financed and business-performed R&D (both 4th), university–industry R&D collaboration (2nd), late-stage venture capital deals (1st), unicorn valuation (1st), software spending (1st) and intangible asset intensity (1st). Canada shares many of these strengths, with notable performance in research talent (9th), late-stage venture capital activity (8th) and software spending (6th). Both economies benefit from having strong Institutions (both in the top 20 worldwide), world-class universities – the United States ranks 1st globally and Canada 6th – as well as deep international and private sector–university connections, with both countries ranking among the top 10 in university–industry and international engagement (6th and 7th respectively). Canada’s rise is part of a wider comeback story among mature innovation systems in 2026.
Against this backdrop of overall strength, there remain areas of opportunity. Labor productivity growth offers room for further gains in both the United States (67th) and Canada (114th), and infrastructure investment relative to overall innovation performance represents a further avenue for development (33rd and 36th respectively).
Innovation activity remains concentrated in leading metropolitan ecosystems. Northern America hosts 23 of the world’s top 100 science and technology clusters, including 20 in the United States. San Jose–San Francisco ranks 3rd globally and 1st in innovation intensity. Canada retains three top 100 innovation clusters: Toronto (36th), Montréal (61st) and Vancouver (67th), with Montréal improving its ranking this year.
Europe
Europe remains the region with the largest concentration of leading innovation economies, headed by Switzerland (1st), Sweden (2nd), the United Kingdom (6th) and the Kingdom of the Netherlands (7th). Twelve European economies improve their positions in 2026. Italy advances to 27th, Spain to 28th and Lithuania to 32nd, among others. Bosnia and Herzegovina records one of the region’s biggest advances, gaining eight places to reach 84th, followed by the Republic of Moldova, which moves up six places at 68th place.
Across the region, strong institutions, research systems and industrial capabilities frequently reinforce one another. Switzerland ranks 1st in Creative outputs, Sweden 1st in researchers, Germany 3rd in global corporate R&D investors and France 4th in intangible asset intensity. Europe’s 30 top 100 innovation clusters concentrate these capabilities, with Cambridge, Oxford, Helsinki and Eindhoven performing especially strongly relative to population.
Rising to 7th, the Kingdom of the Netherlands combines knowledge creation with international business connectivity. Amsterdam–Rotterdam remains among the world’s largest clusters at 26th, while Eindhoven ranks 9th globally by innovation intensity, reflecting a highly patent- and technology-oriented ecosystem.
At 18th place, Austria advances through a balanced research–industry model. Gross expenditure on R&D and business-performed R&D both rank 7th, while researchers (8th), public research–industry co-publications (9th), university–industry and international engagement (9th), and production and export complexity (10th), all place Austria among the stronger European innovation systems. Italy rises to 27th, with outputs (16th) substantially stronger than inputs (36th). Its ecosystem is characterized by its domestic industry diversification (2nd), quality certification (3rd), industrial designs (4th), corporate R&D investors (12th), intangible asset intensity (16th) and production and export complexity (17th). The innovation clusters of Milan (56th) and Rome (81st) reinforce this industrial and creative landscape.
This year’s results show Europe’s strengths, but also its central innovation challenge. While Europe has world-class research, strong institutions, advanced industry and dense innovation clusters, further improvement will depend on turning these strengths more consistently into fast-growing firms, scaleup finance, commercialized technologies and productivity growth. This is also the core message of recent European competitiveness debates: the Letta report argues for a stronger Single Market, including a “fifth freedom” for research, innovation, knowledge and education;
Northern Africa and Western Asia
Israel continues to lead Northern Africa and Western Asia (NAWA) at 15th, followed by the United Arab Emirates (25th), Cyprus (29th) and Saudi Arabia (42nd).
The region encompasses several distinct innovation systems. Israel anchors its performance in R&D expenditure (1st) – equaling 6.8 percent of its GDP in 2024, business-performed R&D (1st), venture capital received (1st) and university–industry collaboration (1st). Türkiye’s industrial designs (6th) and trademarks (7th), Morocco’s industrial designs (5th) and Jordan’s scientific articles (1st) point to specialized strengths in intangible assets, creativity and scientific knowledge. Across the region, the next step is to translate these enabling conditions more consistently into research, firm-level innovation and internationally competitive outputs.
Western Asia’s Gulf economies continue to climb, with the United Arab Emirates reaching the top 25 and Saudi Arabia, Qatar and Kuwait also advancing – as investment in innovation capacity begins to show in the rankings
Within Western Asia, the Gulf economies continue to climb as they pursue knowledge-based diversification beyond resource dependence. The United Arab Emirates gains five positions to reach the top 25, while Kuwait records one of the region’s largest advances, rising 11 places to 62nd; Saudi Arabia and Qatar also move up. Their progress is built on strong enabling conditions, including digital government, ICT adoption, infrastructure, higher education, talent attraction and startup finance. The United Arab Emirates is furthest along in translating these foundations into broader innovation activity, with gains in high-tech manufacturing (48th), patent families (41st), FDI inflows (20th) and green-field R&D and high-tech FDI (1st) (Box 3). Saudi Arabia’s rise is linked to its rapid digital adoption and a more visible innovation geography, with Riyadh entering the global top 100 innovation clusters, while Qatar stands out for Infrastructure (16th) and international talent attraction – ranking 1st in tertiary inbound mobility, and Kuwait for ICT access (4th) and use (3rd).
The key issue now is the conversion from innovation inputs to outputs. As Figure 5 shows, the United Arab Emirates, Saudi Arabia and Qatar remain in the high-input, lower-output part of the innovation landscape: their enabling conditions are strong, but innovation outputs have not yet reached the same level. For the wider group, the next phase will depend on turning capacity-building and infrastructure into deeper knowledge creation, technology production, intellectual property and globally competitive firms.
Morocco leads North Africa’s innovation rise, as Algeria, Egypt and Tunisia also move up
Morocco reaches its best GII rank at 54th, in 2026, leading a North Africa rise, with Tunisia (71st), Egypt (83rd) and Algeria (111th) also rising.
Morocco’s rise reflects a growing combination of industrial upgrading and business use of intangible assets. It ranks 5th in industrial designs, 8th in intangible asset intensity and 16th in trademarks, alongside a solid position in high-tech manufacturing (28th). This suggests that firms are increasingly complementing production capacity with design, branding and product differentiation. To sustain its progress, Morocco could strengthen university–industry links, expand business R&D and improve access to startup and scaleup finance – as investment and venture capital indicators remain at relatively low levels.
Tunisia’s rise adds to the broader North African advance, while its main strength lies in Human capital and research (45th), scientific production and export-oriented capabilities. It remains a relatively diversified economy that has strengths in science and engineering graduates (1st), scientific production (12th), high-tech exports (38th) and green-field R&D and high-tech FDI (18th). These assets give Tunisia a foundation for technology upgrading and participation in more knowledge-intensive production. The main constraint is that this base is not yet matched by a strong business environment (124th), private sector participation in R&D nor deep innovation linkages (112th). The next step is therefore to connect Tunisia’s talent, research and export base more effectively to firms, investment and commercialization, so that scientific and industrial capabilities translate into stronger technology creation, business innovation and higher-value exports.
Egypt (83rd) rises three places, with innovation outputs (75th) continuing to exceed inputs (95th). Its domestic market is large (18th), it has a substantial scientific base relative to other middle-income group economies – with key R&D indicators ranked in the upper tier (research talent at 40th, citable-documents H-index at 44th, university quality at 48th and researchers at 54th), is one of Africa’s most entrepreneurial communities, and its economy has increasingly diversified (27th) over the past years. R&D spending was slightly higher than 1 percent of its GDP in 2024 – only behind the United Arab Emirates in the region. Nevertheless, the ecosystem remains highly concentrated in Cairo – ranked 86th globally among innovation clusters. Moreover, private sector R&D remains limited, as does access to venture capital (88th) and credit to the private sector (101st). However, recent investment indicators are also encouraging, with FDI net inflows rising to 22nd and late-stage venture capital activity ranking 41st.
Algeria (111th) advances four positions, thanks to stronger innovation inputs (99th). Education (3rd) is a notable asset: expenditure on education (2nd), government funding per secondary pupil (2nd) and science and engineering graduates (17th). Gross capital formation (5th), researchers (44th) and entrepreneurship policies (43rd) provide additional strengths. Building further on these strengths through business R&D and Knowledge and technology outputs (120th) would support a more balanced innovation profile.
South East Asia, East Asia, and Oceania
South East Asia, East Asia, and Oceania remains one of the world’s most dynamic regions for innovation, while also exhibiting considerable internal diversity in terms of innovation performance. The Republic of Korea leads the region at 4th globally, followed by Singapore (5th), China (10th), Japan (12th) and Hong Kong, China (14th).
The region features world-leading R&D investment, with six of its economies ranking among the top 25 for R&D expenditure as a share of GDP, led by the Republic of Korea (5.1 percent of GDP in 2024), Japan (3.6 percent) and China (2.7 percent). Corporate R&D investment and capacity are high across most of the region’s economies, with companies in China (2nd), the Republic of Korea (4th), Japan (7th), Australia (15th) and Singapore (21st) among the biggest private R&D spenders worldwide. Private sector involvement in financing R&D is also substantial, exceeding 50 percent of total R&D spending in economies such as Thailand (67 percent of R&D expenditure financed by the private sector in 2023, ranked 5th worldwide), Viet Nam (58 percent, 13th) and Malaysia (55 percent, 19th).
The region’s middle-ranked economies – Malaysia (34th), Viet Nam (43rd), Thailand (44th), the Philippines (52nd) and Indonesia (55th) – are strongly integrated into regional and global value chains, with shared strengths in high-tech trade, high-tech manufacturing (Malaysia ranks 17th worldwide), ICT services (the Philippines ranks 18th in ICT services exports) and growing startup activity. Indonesia ranks 26th in late-stage venture capital, while Viet Nam holds 34th place in unicorn valuation, equivalent to 1.2 percent of its GDP. Creative outputs represent an increasing strength, with Viet Nam ranking 5th worldwide in mobile app creation, and Malaysia (16th), Thailand (27th), Viet Nam (28th) and the Philippines (30th) all placing in the top 30 for brand value.
Mongolia and Cambodia record among the region’s largest ranking gains this year.
Mongolia rises to 72nd, driven primarily by strengthening innovation outputs (57th). Progress is especially visible in Creative outputs (41st), supported by exceptional performance in trademarks and industrial designs – both ranked 3rd globally – and contributing to growth in intangible assets (8th).
Cambodia ranks 93rd. Its principal strength remains Market sophistication (31st), while Business sophistication registers a notable rise – although at a low level (117th), reflecting improvements in public research–industry co-publications (78th) and cluster development (69th).
Central and Southern Asia
India leads Central and Southern Asia at 38th place, followed by Kazakhstan (73rd), Bhutan (74th, a new entrant) and Uzbekistan (77th). Kazakhstan records the region’s largest rise gaining eight places, while both Kyrgyzstan and Pakistan advance four places to 92nd and 95th respectively.
The region has a diverse set of innovation assets. India leads in ICT services exports (1st) and ranks highly in late-stage venture capital deals (4th) (see Box 2), while Pakistan combines strength in ICT services exports (15th) and mobile app creation (10th). Human-capital advantages are visible in science and engineering graduates in Uzbekistan (2nd) and the Islamic Republic of Iran (9th), as well as in Bhutan’s tertiary inbound mobility (4th). Access to capital is another regional feature: the Islamic Republic of Iran ranks 2nd in gross capital formation, while Nepal (3rd), Bangladesh (12th) and Kyrgyzstan (15th) perform strongly in microfinance. Tajikistan’s utility models (1st) and low-carbon energy use (12th), together with Sri Lanka’s energy efficiency (10th on the GDP/unit of energy use indicator), are examples of further areas of specialization. Across the region, the challenge is to connect these strengths more closely through investment in research, infrastructure and innovation linkages.
Kyrgyzstan rises to 92nd, supported by having stronger Knowledge and technology outputs (79th). Its profile combines high labor productivity growth (2nd), cultural and creative services exports (17th), education expenditure (8th), microfinance (15th) and tertiary inbound mobility (16th).
Latin America and the Caribbean
Latin America and the Caribbean continues to be led by Chile (51st), followed by Brazil (53rd), Mexico (65th), Uruguay (66th) and Costa Rica (70th). Brazil remains the region’s only economy performing above expectations for its level of development, sustaining this status for a sixth consecutive year. The largest advances are recorded by the Bolivarian Republic of Venezuela, rising to 127th, Ecuador to 106th, Trinidad and Tobago to 107th, and Nicaragua to 124th.
Latin America and the Caribbean has important innovation assets: Brazil has the region’s deepest science and R&D base, Mexico benefits from manufacturing and export capabilities, and smaller economies such as Uruguay and Costa Rica build on services, institutions and digital connectivity. Yet these strengths remain concentrated in a limited number of economies and have not translated into a strong regional engine. Brazil remains the region’s only innovation overperformer and the only economy with R&D expenditure above 1 percent of GDP.
The main challenge is not only conversion from inputs to outputs; it is also the limited availability of some of the innovation inputs themselves. Many economies perform better on innovation inputs than outputs: Chile ranks 41st in inputs, but 70th in outputs, Uruguay 56th and 77th, Costa Rica 62nd and 76th, and Trinidad and Tobago 96th and 121st. This gap reflects weak links between knowledge creation, firms, finance, intellectual property and international markets. The region has some strong universities, especially in Argentina, Brazil, Chile, Colombia and Mexico, but university–industry collaboration remains limited across many economies. Scientific production, business R&D, scaling finance and institutional coordination are also uneven. Venture capital and startup activity are similarly concentrated, with Argentina, Brazil, Chile, Colombia and Mexico leading late-stage venture capital, while Brazil and Colombia stand out more clearly in the unicorn valuation and startup-related indicators. The result is a region with real innovation potential, but where research, entrepreneurship and market access are not yet connected strongly enough to scale ideas into technology, exports, brands and productivity gains.
Uruguay (66th) rises two places, combining strong Institutions (29th), policy stability for doing business (7th), low-carbon energy use (10th) and ICT services exports (16th). National feature films (9th) and cultural and creative services exports (23rd) reinforce its service-oriented ecosystem.
Argentina (75th) gains two places, with outputs (66th) exceeding inputs (83rd). Tertiary enrolment (8th), school life expectancy (9th), trademarks (25th), domestic market scale (28th) and university quality (38th) provide a diversified base.
Ecuador (106th) advances seven places, drawing on government online services (25th), microfinance (29th), trademarks (38th), tertiary enrolment (48th) and software spending (50th).
Sub-Saharan Africa
Mauritius leads Sub-Saharan Africa at 50th position, followed by South Africa (63rd), Botswana (82nd) and Senegal (90th). Rwanda records the region’s largest rise, advancing to 96th place, followed by Madagascar at 113th; Botswana and Kenya (97th).
Innovation in Sub-Saharan Africa is becoming more visible in 2026, with several economies showing important gains
Innovation in Sub-Saharan Africa remains uneven, but is becoming more visible in 2026, with clearer leaders, overperformers, specialized strengths and improved data coverage. Beneath still-low regional averages, several recurring assets support future innovation gains. Education investment is a notable strength in Namibia (1st), Botswana (3rd), Mauritania (4th), Lesotho (10th), Mozambique (19th) and Burkina Faso (30th), while capital formation supports ecosystems in the United Republic of Tanzania (7th), Angola (13th), Zambia (17th) and Chad (30th). Access to microfinance is another common feature, particularly in regards to Togo (5th), Lesotho (9th), Senegal (10th), Benin (22nd) and Côte d’Ivoire (32nd). And youthful populations provide long-term potential in Niger (1st), Mali (2nd), the Democratic Republic of the Congo (4th), Burundi (5th), Uganda (7th), Ethiopia (19th) and Ghana (26th).
More specialized capabilities are also emerging. Malawi performs strongly in ICT services imports (1st), Cabo Verde in labor productivity growth (11th), Nigeria in unicorn valuation (19th) and Cameroon in entrepreneurship policies and culture (19th). A thin but real startup and venture-capital layer is also visible around selected hubs, with economies such as Kenya, Mauritius, Nigeria and Rwanda attracting private capital, although early-stage funding remains limited. The first inclusion of the Democratic Republic of the Congo (137th) and Chad (139th) in the GII reflects improved innovation-data collection and broadens the evidence with which to assess the region. Overall, Sub-Saharan Africa’s innovation performance is not uniform: it combines gaps in skills, infrastructure and outputs, with identifiable hubs of education investment, entrepreneurship, finance, digital activity and data-system improvement.
An output-led advance distinguishes Botswana. A rise in trademarks to 18th points to a growing use of intangible assets, while education expenditure (3rd), gross capital formation (9th), microfinance (16th) and market capitalization (24th) provide a supportive base. Improving FDI inflows (49th) and labor productivity growth (47th) serve to further strengthen its profile.
In Rwanda, a stronger score on Institutions (26th) and increasingly connected finance and research systems characterize its progress. Policy stability ranks 2nd, while venture capital received (31st), microfinance (24th) and university–industry R&D collaboration (44th) support gains in labor productivity (10th), utility models (26th) and scientific publications (47th).
Kenya’s rise reflects a growing entrepreneurial and technology ecosystem. Utility models rank 8th, alongside venture capital received (30th), late-stage venture capital deals (34th), ICT services exports (30th) and low-carbon energy use (11th). Gains in high-tech imports (29th), industrial designs (59th) and mobile app creation (61st) suggest a widening of innovation activity.
Despite comparatively modest inputs (130th), Madagascar performs strongly in industrial designs (15th), trademarks (22nd) and ICT services exports (29th), with further gains in cultural and creative services exports (68th) and PCT patents by inventor origin (81st) – although at relatively lower levels.
Conclusion
The GII 2026 points to four broad conclusions about the current state of global innovation.
First, the global innovation remains highly persistent at the frontier, but is not frozen. Switzerland, Sweden and the United States continue to lead the ranking, while Europe remains the region with the largest concentration of innovation leaders. Asia is now firmly embedded in the upper ranks, with China holding 10th place as the only middle-income economy among the innovation leaders. Beneath this continuity, there is still movement: the Kingdom of the Netherlands moves higher, Canada, Australia and New Zealand regain ground, and the United Arab Emirates enters the top 25. The top of the GII therefore remains structurally stable, but is still highly competitive.
Second, middle-income innovation catch-up is real, but an innovation “glass ceiling” is becoming more evident. The fastest long-term climbers since 2013 – China, India, Indonesia, Morocco, the Philippines, Türkiye and Viet Nam – have advanced by building competitive firms, export sectors, digital services, startup finance and high-tech production, and through a stronger use of intellectual property. These strengths have helped them enter the upper half of the GII, but not all have continued moving upward at the same pace. For many, the next step is harder: breaking beyond the top 40 or top 50 requires deeper research capacity, stronger universities andmore business R&D, patenting, science–industry linkages and domestic knowledge creation. China is the exception that defines the challenge, combining its commercial and production strengths with the research capacity and investment needed to reach the top 10. The question for the next wave of climbers – including Saudi Arabia, Qatar, Mauritius, Brazil, Jordan and Bahrain – is whether they can avoid a similar plateau by turning recent gains in investment, digital infrastructure, services and scientific output into broader and more sustained innovation performance.
Third, innovation momentum is spreading through different regional and sectoral pathways. In Western Asia, the Gulf economies continue to climb through major investments in digital infrastructure, finance, talent and state-led diversification, with the United Arab Emirates furthest ahead in converting these inputs into outputs. In Africa, Morocco leads a North African rise, while Mauritius, Rwanda and Madagascar show momentum in Sub-Saharan Africa, alongside a growing but still thin venture and startup layer around selected hubs. Latin America and the Caribbean has important assets in Brazil, Chile, Mexico, Uruguay and Costa Rica, but its innovation engine remains too concentrated and underpowered to generate sustained regional gains.
Fourth, innovation performance is not determined by income alone. The 2026 overperformers show that economies can generate more innovation than expected for their level of development when they build on focused strengths. India and Viet Nam remain the longest-standing overperformers, while Jordan, Malawi, Rwanda, South Africa, Thailand and Ukraine confirm that overperformance can persist across regions and income levels. Mozambique, Pakistan and the Republic of Moldova return to the group, and Bhutan enters the GII as an overperformer in its first year. The wider lesson is that innovation success depends not only on resources, but on how effectively economies connect research, firms, finance, skills, institutions and markets into functioning innovation ecosystems.
The broader implication is that innovation policy should focus increasingly on system coherence. Strong pillars or strong performance on individual indicators are valuable, but sustained progress depends on how effectively institutions, skills, infrastructure, finance, firms and creative capabilities reinforce one another. For policymakers, the priority is therefore not simply to raise inputs or target a higher rank, but to strengthen the paths through which innovation generates knowledge, productivity, competitiveness and wider economic value.