Venture Capital in 2023: Dollars Dwindle, but Number of Deals Sealed Stand Strong
December 19, 2023
By Vanessa Behrens (WIPO)
After the venture capital (VC) boom during the COVID-19 pandemic in 2021, and signs of weaknesses in 2022, the widespread fear was one of a severe VC downturn in 2023.
The concern is that stricter monetary conditions could result in a significant decline in venture capital, especially in its flow to underserved regions like Latin America and Africa. This would be unfortunate, as a shortage of VC funding may result in insufficient investment in innovation.
Drawing insights from preliminary data for 2023 - provided by our GII collaborator Refinitiv - we observe that the number of VC deals sealed continues to be at historical highs. However, the dollars invested in VC are dwindling.

Venture capital activity was strong during the height of the pandemic
Despite the COVID-19 pandemic, 2021 was an exceptional VC boom year; with a record $611 billion of investments into VC. The number of VC deals continued to grow by 23% on 2022[1], representing a growth rate that is twice as large as the average annual growth rate of 11% witnessed over the preceding decade (2012-2022)[2].
In total, $394 billion flowed into VC deals across the globe in 2022; a 36% decline from 2021. Although these were the first signs of slowing VC activity, one must admit that it was hard to live up to the exceptional VC boom year of 2021 (see figure 2).
Latin America and the Caribbean (+57%) and Africa (+53%) witnessed the strongest growth in deal numbers between 2021 and 2022, albeit from a comparatively low starting point. Africa was the only region to avoid a year-on-year decline in the value of VC investments (securing $2.7 billion in 2022). In contrast, VC investments in all other regions reverted to levels consistent with trends preceding the 2021 peak.
Number of VC deals sealed stand strong in 2023, while the value of VC investments declines severely; Africa expected to be least impacted
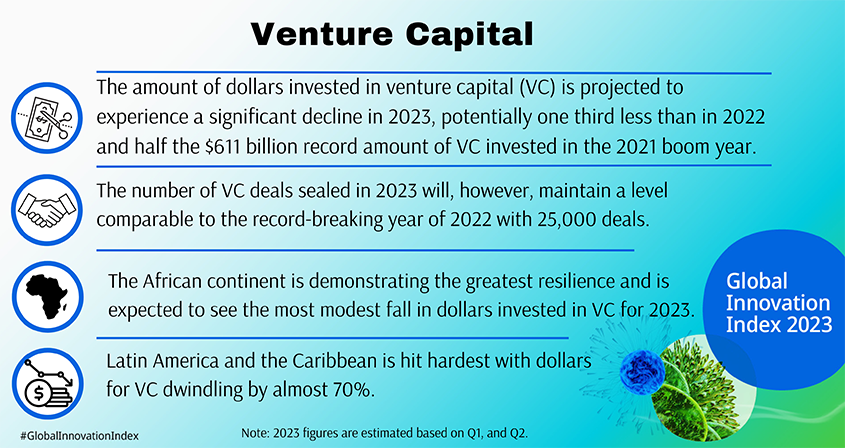
The number of VC deals are expected to stagnate in 2023, maintaining a level comparable to the record-breaking year of 2022 (25,000 deals) (see figure 1)[3]. The remarkable year-on-year growth in deals, evident in the VC boom years of 2021 (+48%) and 2022 (+23%) depicted by the pink line in figure 1, will thus not be replicated in 2023. Instead, it is expected to taper off to approximately zero growth.
Figure 1: Number of VC deals and year-on-year growth
Source: WIPO, based on data by Refinitiv Eikon (private equity screener), accessed September, 2023.
Turning our attention to the value of VC, the outlook for 2023 is less optimistic. In contrast to the steadiness observed in VC deal numbers, the dollars invested in venture capital is projected to experience a significant decline in 2023, potentially one third less than in 2022. This will result in the average dollar investment per deal to decrease from $16 million in 2022 to $10 million in 2023. The wellspring of risk finance funding appears to be dwindling.
The first half of 2023 witnessed a global injection of $124 billion in VC investments. However, as the complete data for 2023 materializes, it is expected that the total value of VC investment will persistently lag behind the peak observed in 2021 ($612 billion). Depending on the unfolding developments in inflation and monetary tightening, this could lead to financial constraints for VC in the third and fourth quarters of 2023, potentially resulting in a stark decline compared to 2022 (see figure 2).
While it is anticipated that all regions will encounter a decline in VC investments in 2023 compared to 2022, Africa will be the least impacted. By comparing only complete data (i.e. the first half of 2022 compared to the first half of 2023), one finds that Latin America and the Caribbean faced the most substantial VC reduction, with a 79% drop. In contrast, the African continent demonstrated greater resilience with a comparatively modest 27% decrease. The remaining regions, including Asia Pacific, Europe, and Northern America, all experienced declines of approximately 45%.
Figure 2: Total value of VC investment and year on year growth
Source: WIPO, based on data by Refinitiv Eikon (private equity screener), accessed September, 2023.
A full comparison of 2023 to 2022 and prior years, however, will have to wait until March 2023. Stay tuned for a fuller assessment on this when the GII 2024 is released in September, 2024.
Background: The Global Innovation Index 2023 uses three VC indicators (4.2.2 VC investors, deals /bn PPP$ GDP, 4.2.3. VC recipients, deals/bn PPP$ GDP, and 4.2.4 VC received, value, % GDP), which are obtained thanks to the collaboration between Refinitiv, an LSEG (London Stock Exchange Group) business, and the World Intellectual Property Organization (WIPO). Refinitiv’s private equity screener (Eikon) provides VC data on deal level, amount invested, as well as investor and recipient information, going back at least to 1995.